Table of Contents
What Is Coppock Curve?
Coppock curve is an indicator widely used in technical analysis that studies the trends in the market to provide entry and exit signals that traders use to make investment decisions. Edwin Coppock introduced it in 1962.
It is primarily used for long-term investments since it uses a monthly time frame. This momentum indicator is calculated using a weighted moving average and helps recognize essential changes in trends in the market, providing profitable trading opportunities.
Key Takeaways
- Coppock curve is a technical indicator that traders use to analyze the long-term change in price trends within the financial markets.
- Edwin Coppock designed it in 1962, which is commonly used for determining trading opportunities in the financial market.
- The calculation uses the moving average and calculates the short-term and long-term changes in the market, resulting in smoothening out the disturbances.
- It can be easily applied while trading in various financial instruments, and investors can identify potentially profitable trading opportunities.
Coppock Curve Explained
Coppock curve is a technical indicator that identifies positive trends in the financial market that are profitable for long-term investments. It is commonly used to determine monthly investment strategies. Edwin Coppock invented it in 1962 with the aim of using economic ideas and market sentiments for trading in the market.
The formula of coppock curve indicator uses moving averages for both the short and long term to understand the rate of price change, which is used to identify trends. Traders can estimate the buy and sell points, which are necessary to take profitable trades. It can be used across various asset classes to identify upturns within the market.
However, it is not used as a standalone indicator for technical analysis, and it should be combined with other widely used ones like the MACD (Moving Average Convergence Divergence), RSI (Relative Strength Index), Bolinger Band, pivot points, different candlestick patterns etc, for better and more reliable results.
Thus, even though coppock curve strategy has its limitations, the tool is widely used for assessing changes in price trends, which helps traders make long-term investment decisions.
How To Calculate?
This section elaborates on the calculation and formula for the process. In the calculation, the rate of change is established using the weighted moving average. There are two kinds of moving averages used in the process: 14- period and 11- period. The weighted moving average of both results in a 10-period weighted moving average that smoothens out the curve. The formula used is as follows:
Coppock Curve = WMA
The process of coppock curve indicator is mainly used to find buying opportunities in the market. Investors will first determine the closing price and then the 14-period and the 11-period moving average. Then, the summation is calculated to calculate the weighted moving average of 10 periods, which creates a smooth curve. Once plotted within the chart, the trader is able to identify excellent and profitable buying opportunities for that stock or any other financial asset.
How To Read?
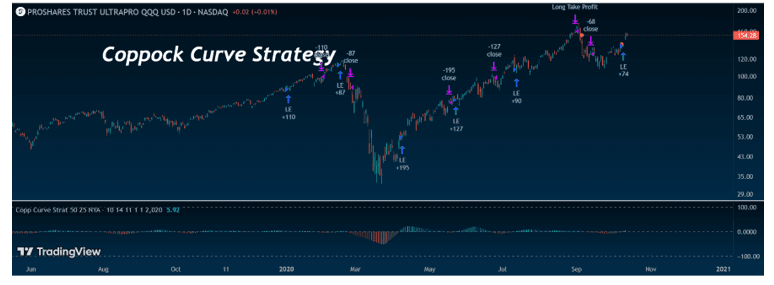
The concept of coppock curve strategy is explained very well in the TradingView chart below. Here, the curve is created using the weighted average calculation of the rate of change related to the market index. This curve generates clear buy signals within the chart, as marked using arrows. The curve acts with respect to the zero line, and when it crosses above the zero line, a buy signal is generated. Traders should enter the market at this point. A sell signal is when the curve falls below the zero line.
How To Trade?
As already detailed above, the coppock curve settings generate clear buy and sell signals. The trader has to notice whether the curve rises or falls with respect to the zero line. Above the zero line is the buy signal, and below it is the sell signal.
However, it should be noted that the signals are long-term in nature since the calculation uses monthly price information. Therefore, it does not generate signals frequently.
This momentum oscillator helps in acquiring a smooth curve for trend prediction and can be used for any asset class. Even though it is most suitable for monthly or longer time frames, it may also be used for shorter ones if the trader wants more signals for better understanding and short-term trades.
Examples
Here are some examples to understand the concept of coppock curve settings with clarity.
Example #1
John owns the Index Exchange Traded Fund (ETF) and is looking for an exit point. He uses the Coppock Curve to find the exit strategy from the market. As per the curve, a sell signal is when the curve goes below the zero line. Currently, the curve is above the zero line, suggesting a hold strategy. Therefore, he needs to wait till the curve falls below the zero line.
Example #2
This bullish indicator is commonly used in the global market for bullish signals. This has proved helpful for the US stock market a number of times, setting the long-term trend signal for the market participants. After a long and gradual fall in the market, the indicator finally rendered a buy or entry signal. This would mean there is a change in trend, and momentum will gain in the upward direction very soon.
Advantages And Disadvantages
Given below are some advantages and disadvantages of the coppock curve chart.
Advantages
- Since it indicates prices for the long term, it will provide profitable trading opportunities for the longer term. Therefore, traders who want long-term investments can use it.
- The calculation is easy to understand and interpret.
- This indicator is very useful in a trending market.
- It can filter out poor trades with shorter timeframes.
Disadvantages
- Coppock curve chart is not very suitable for short-term strategies because it uses monthly price data to calculate the moving average.
- If used for the short term, it will generate signals frequently, which may confuse traders.
- It is a slow and lagging indicator and often generates signals after the market price action takes place.
- It sometimes generates signals that are not clearly correlated to the price.
This concept does not display stop-loss levels, which are crucial for risk management.
Coppock Curve Vs. Relative Strength Index
Both the above technical indicators are used to gauge the price momentum within the market. But there are some differences between them, which are as follows:
- The former is used primarily as a long-term indicator, but the latter is used for both long-term and short-term.
- The calculation process is different for both. The former uses simple average calculation within the formula, and the latter uses a weighted moving average in the formula.
- Calculating the former is a complex process compared to the latter.
