Table of Contents
What Is Friedman Test?
The Friedman test is used to identify and measure the gap between the mean value and the sample population used for more than two tests. It is a nonparametric test that compares multiple paired data groups to check on the difference between results occurring from them across several test attempts.
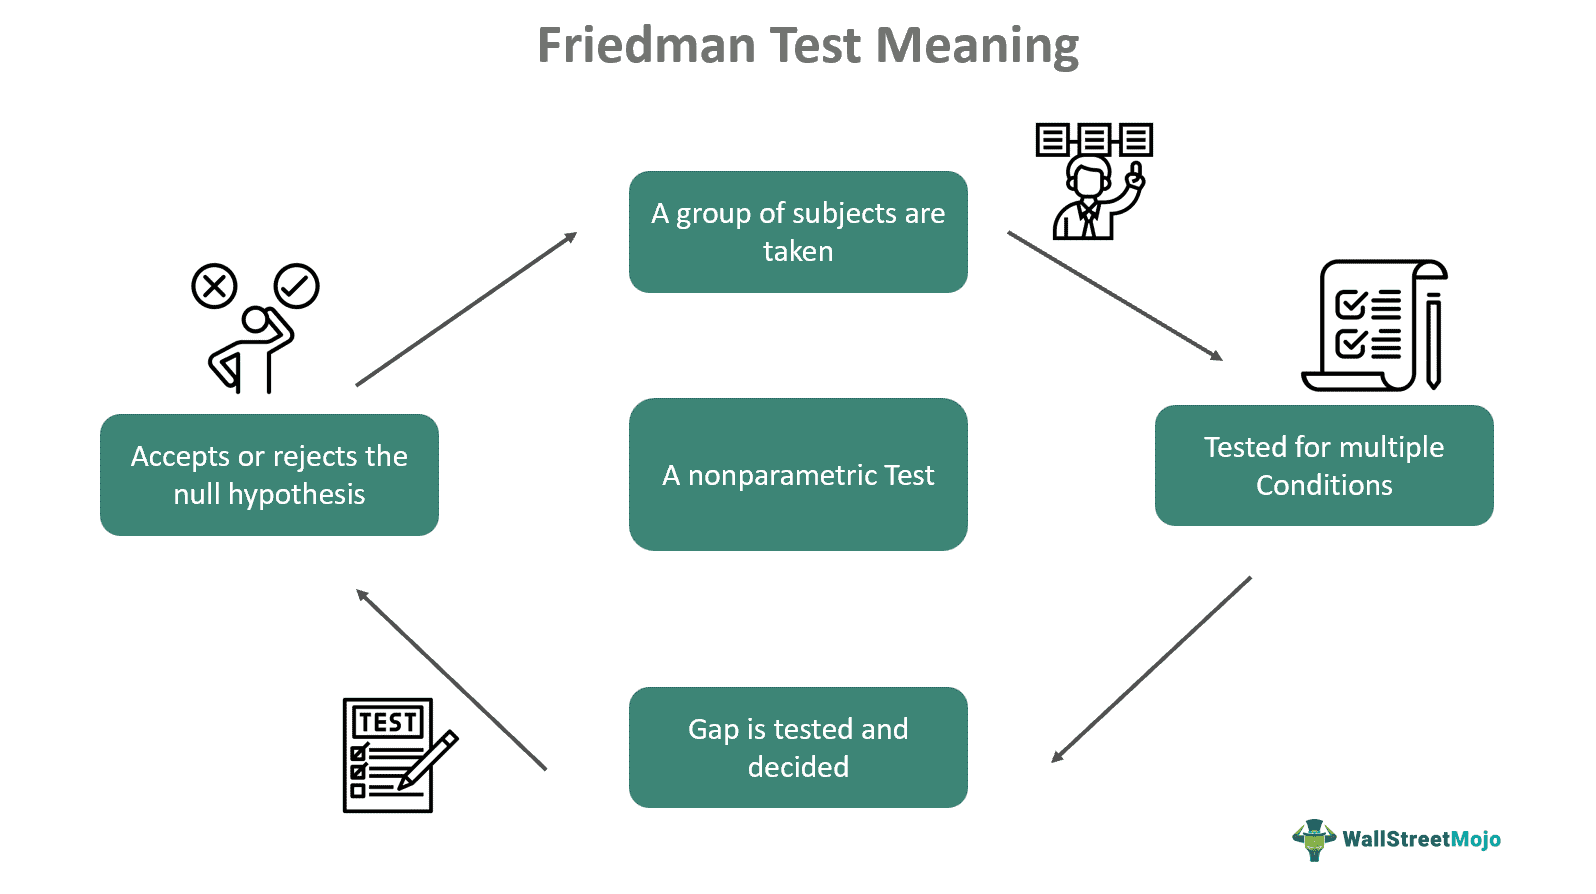
A typical scenario is when a sample population is tested for more than two conditions; this test allows for verifying whether there is a difference between the mean results, given that the same population has been part of all the scenarios. The core concept is that a single sample population goes through multiple tests. It is also called Friedman's one-way repeated measure analysis of variance by rank.
Key Takeaways
- The Friedman test measures and identifies the difference between the outcome mean collected from more than two data groups for a sample population.
- It is a distribution-free nonparametric test introduced in 1990 by Milton Friedman, an American economist.
- If the p-value is less than the significance level, it indicates sufficient evidence to reject the null hypothesis (H0). In contrast, if the p-value is higher, then the difference is not significant.
- Typically, a difference of 0.5 or 5% is sufficient to reject the null hypothesis (H0) in this test.
Friedman Test Explained
The Friedman test is applied to examine the difference among a series of related samples. It is an alternative for repeated measures analysis of variances, generally applied when the same parameter has been gauged under different circumstances on the same subject. The test was introduced by Milton Friedman in 1990, an American statistician and economist who was also the recipient of the 1976 Nobel Memorial Prize in Economic Sciences.
The Friedman test statistics, in a nutshell, explains the effects and variance in mean analysis when the subject remains the same but is repeatedly tested for different conditions. A simple instance would be a group of people asked to use a product and rank their experience for three or more different products. The test has a broad scope of applications in medical science, business marketing, finance, and social studies.
For Friedman test interpretation, the gap between the medians is checked, and there is a preset significance level against which the p-value is compared to assess the null hypothesis, which initially states that the population medians are equal. A significant difference (α) of 0.05 is sufficient to indicate a 5% risk of the difference’s existence. For simple understanding, when the calculated P is less or equal to the significance level, it means that the gap between medians is significant enough to reject the null hypothesis. Conversely, if the p-value is higher than the preset level, the difference of medians is not prominent.
Assumptions
The assumptions of this test are:
A single sample or data group is gauged or tested for three or more scenarios or conditions.
- The sample or group must be from a random population.
- The group or sample is not required to be normally distributed.
- The dependent variable is measured at continuous or ordinal levels to provide quantifiable statistics.
Examples
Let us look at some examples to understand the concept better:
Example #1
For a hypothetical example, suppose a hotel wants to know the mean favorite of people on three different cuisines. For this, the management invites nine customers to measure their preferences on a scale of one to ten. Now, this test is applied to seek and measure the difference in mean between all three cuisines. Therefore, the null hypothesis (H0) in this study will be that there is no gap between the variables; it is considered the initial claim based on previous analyses.
The hotel can use different software packages to calculate. Suppose there is a value that does not match the null hypothesis (H0). In that case, it will be rejected, concluding a difference in mean in all three cuisines, which is considered the alternative hypothesis (H1). Additionally, there are many calculators available online for this test for people to use.
Example #2
In the second example, there is another question based on the Freidman test determination, in which 12 people are invited as subjects to taste and rank three types of wines: red, white, and rose. Each of the twelve people was asked to give them scores based on their taste, from one to ten.
The test clearly states the initial Friedman test formula along with designations given to each variable used in the equation. The question is solved using MS EXCEL. The calculation shows probability (P) = 0.408, which is higher than the outcome, which means that there is no prominent gap between the three types of wines.
Advantages And Disadvantages
The advantages of this test are:
- The test does not require heavy calculations and is easily understandable.
- In terms of ranking, the data doesn’t have to be normally distributed.
- This test can be applied to all forms and types of data.
- It can be applied when there are more than two dependent samples.
The disadvantages of this test are:
- It is a nonparametric test but could be more efficient than a parametric test study.
- The results of this test can be ambiguous, and because they are distribution-free, the outcome may need to be more accurate.
- These test’s ranks are only based on the order of scores within each participant. Hence, the difference between subjects is not considered.
Friedman Test vs Kruskal Wallis Test
The main differences between both the tests are:
| Friedman Test | Kruskal Wallis Test |
|---|---|
| Examines the gap between groups when the dependent variable is ordinal. | It checks if groups belong to the same distribution by determining the same median. |
| This test is used when there are three or more related sample groups. | The Kruskal-Wallis test can be used for just two groups. |
| Milton Friedman proposed this test. | Kruskal-Wallis test was proposed by William Kruskal and Allen Wallis in 1952. |
