Table of Contents
What Is Pin Bar Candle?
Pin Bar Candle is a pattern in technical analysis that traders widely use to understand the price action. This kind of candlestick identifies trend reversal. Even though it has variations, it helps in making important trading decisions.
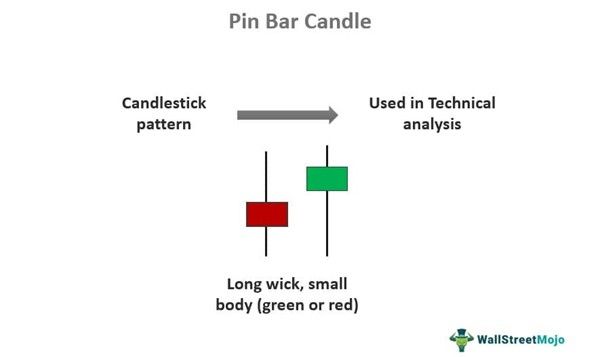
The pattern looks like having a long tail or a shadow with a small body. They denote a sharp price rejection, ensuring a change in direction. It can be bullish or bearish but gives a strong confirmation in both cases.
Key Takeaways
- Pin Bar Candle is a candlestick pattern that is frequently used as a part of technical analysis to identify price reversals.
- Traders can confidently use it to make trading decisions while looking for entry or exit opportunities.
- It has a small body as compared to a long wick or shadow and can be either green or red, signifying a bullish or bearish market.
- When combined with other indicators like moving averages, oscillators, or other candlesticks, it confirms the possibility of current price reversal.
Pin Bar Candle Explained
A pin bar candle is a type of candlestick pattern used during technical analysis. It has a long wick or a shadow but a tiny body. Traders who have the skill to spot it in a chart successfully can use it to identify reversal points that are usually either an entry or an exit position.
The body is relatively small, meaning that there is not much difference between the opening and the closing prices. The end of the long wick, or the shadow, indicates the point of price rejection, either up or down.
If the long wick is below the body, it is an indication that the price will possibly move up. In such cases, the body will usually be green, and the pattern will be bullish. The opposite will happen if the long wick is above the body. The price of the financial instrument may go down, and the candlestick is considered bearish with a red pin bar candle.
It is equally important to note the position of the candle in the chart, whether it is at the end of a downtrend or an uptrend. However, this cannot be used as a standalone indicator; instead, it should be combined with other technical indicators to get a more decisive confirmation.
Types
The common types of this candlestick pattern are as follows:
Bullish Pin Pattern – This gives a bullish signal, meaning the market can move up. In this, there is just one candlestick, which has a small body and a long wick below the body, denoting the upward price strength. The body of the candle can be either red or green pin bar candle.
Bearish Pin Pattern – This type gives a bearish signal, which means the market tends to move down. The candle has a small body that can be either a green or red pin bar candle, but the long wick or shadow is on top of the body, indicating the selling pressure for the financial instrument.
How To Identify?
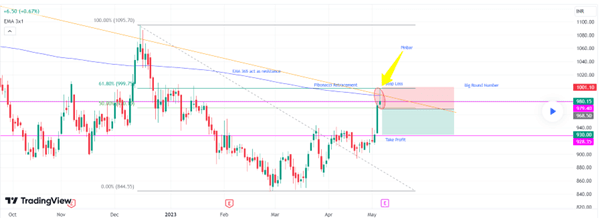
Identifying the pin bar candlestick pattern strategy in a TradingView chart will make it more interesting. Here is a chart where the pattern is easily visible and marketed with a yellow arrow and circled in red. The chart shows that the pattern is formed after a huge green bullish candle, and the tip of the wick of the pin bar, which is formed above the body, touches the resistance line 1001.10, which is very crucial.
This means that the pin bar signifies a possibility of a down move because it has a long upper wick, giving a solid selling signal. Moreover, since it formed at the end of an uptrend, there is another confirmation of a downward trend reversal. The trader can take a short position with a stop loss at the tip of the upper wick and exit the market when the price falls to the level of the tip of the lower wick of the previous bullish candle.
How To Trade?
A few steps can be used to trade using this pin bar candlestick pattern strategy in the chart.
Step #1 – The trader should understand the significance of the tail’s position in the candle. If the tail is below the body, the price will move up, and if the tail is above the body, the price will move down.
Step #2 – The candle will give the most effective confirmation in case of any levels that can be considered as the key resistance or support level. This will make it more reliable.
Step #3 – In every trade, volume plays a crucial role, no matter what the candlestick pattern is. Therefore, in this case, the trader should observe the volume of trading taking place below that pin bar pattern.
Step #4 – Finally, the trader should check all other available indicators, like the moving averages, oscillators, and other relevant candlestick patterns. Any other breaking of trendline or divergences and reversals will be added to the confirmation.
Examples
It is possible to understand the concept of red or green pin bar candle with the help of some suitable examples, as given below:
Example #1
Jack is an intra-day trader who has identified a green pin bar pattern in the 15-minute chart of ABC Inc. It has formed at the end of a downtrend and has a long shadow below the body, indicating a price-up move. He has also noticed a significant rise in the trading volume of the stock. Thus, he enters at this point, and after a couple of hours, the price moves up, giving him considerable profit.
Example #2
Nifty50 had seen a pin bar candle pattern, which showed a bullish signal. It had a long lower wick and a small body, indicating a solid buying trend. It was spotted on a daily chart when the trend continued, making higher highs and higher lows for the fourth consecutive session. However, analysts had cautioned investors and traders and warned them to remain vigilant regarding price moves for the next few days in order to get a proper confirmation.
Advantages And Disadvantages
Advantages
Some advantages of the pin bar candlestick indicator are given below:
- They show strong confirmation near any support or resistances, Fibonacci levels, or trend lines. Thus, when they are combined with other confirmatory signals, they become beneficial.
- The traders can identify them very quickly because they are clearly visible. These reversal patterns show the exhaustion points of buying and selling from the trends that have prevailed for a long time.
- They can be detected on any trading platform, making it easy for traders to identify and use them for decision-making.
Disadvantages
Some notable limitations that every trader should know about this pin bar candlestick indicator formation are given below:
- Like any other technical indicator, this pattern is also not a foolproof one. There is always a possibility of an incorrect signal, especially if there is significant fluctuation in prices. Therefore, it is always better to use it in combination with other indicators for better confirmation.
- They are good indicators for trend reversal. However, they are not momentum indicators, meaning they do not provide information about the strength of the reversal or price direction.
- It is not very useful in a market that is currently ranging and moving sideways. This is because they mainly show reversals, which means they indicate market movement upwards or downwards.
Pin Bar Vs Hammer Vs DOJI
Given below is a comparison between pin bar, hammer, and doji, all of which are widely used technical indicators.
| Pin Bar | Hammer | DOJI |
|---|---|---|
| 1) The long wick will be either on top or bottom. | The long wick will be either on top or bottom. | The wick will be almost equal on both the top and bottom. |
| 2) Huge wick. | Huge wick. | Wick may or may not be very long. |
| 3) It signifies trend reversal. | It signifies trend reversal. | It signifies indecision. |
| 4) Umbrella term for all Hammers. | A particular type of pin bar. | Different from both the hammer and pin bar. |
