Table of Contents
What Is Price Consumption Curve (PCC)?
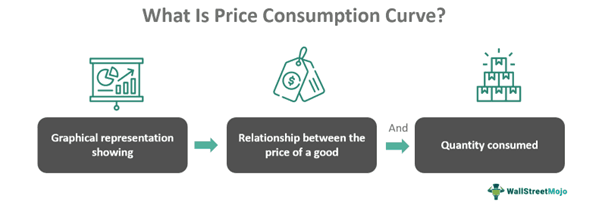
The price consumption curve (PCC) shows the variation in the number of commodities purchased by customers about their price change. It helps in the derivation of the demand curve besides describing the substitution and income implications of a specific decline or increase in a good's price.

The curve shows the best combination of two consumable products that a consumer buys at various price points, one consumable item over the other whose price and consumer income remain constant. It happens because consumers have a limited budget to spend shopping for goods. Therefore with slight changes in the price of one good, consumers tend to compensate for it by varying their purchase of other goods.
Key Takeaways
- The price-consumption curve (PCC) depicts the fluctuation in the amount of a good that consumers buy in response to a change in price.
- Along with outlining the income and substitution implications of a particular drop or growth in a good's price, it aids in formulating the demand curve.
- In PCC, when a commodity's price is decreased at a constant budget, it gets plotted. In contrast, in the income consumption curve, the price of the commodities remains constant at constant income, then it gets plotted.
Price Consumption Curve Explained
price consumption curve definition is stated as the location of a multitude of equilibrium points exhibiting maximum consumption of goods; the budget line's slope varies with variation in goods price. However, it makes such a prediction on the assumption that the cost of other goods and the customers' income remain constant. Using the PCC, economists have derived individual consumer curves. It is common practice that when the price of any good changes, it affects the budget of consumers, who then try to readjust and find the best point to accommodate all goods in their budget.
For better understanding, let's consider a goods X represented by the X-axis. Here, the cost of other similar goods and the income of the consumer remains constant. Initially, the consumer equilibrium had been at the point where the X and other products had the same price. Now, the price of goods X started to fall at successive levels. Thus, it will lead to the shift of the budget line further from the point of origin, making the curve more flat with every price fall.
As a result, the consumer will be forced to find a new equilibrium on the indifference curve every time, which will be higher and higher during the ongoing maximum satisfaction process. Hence, one observes that if the price of one of the two products falls, it makes the consumer satisfy its needs by moving further from the point of origin while going higher and higher on the indifference curve.
In other words, the number of goods bought changes with an increase in the price of one product over another. Here the purchasing power also gets lowered. The substitute product becomes less costly due to it. It enables one to jump to other cheaper products instead of a costlier product.
Examples
Let us understand the concept with the help of some examples.
Example #1
Let us suppose a customer used to buy white bread more often than brown bread. However, the price of white bread increased by one dollar, whereas the consumer's income did not increase. Hence in this scenario, the consumer would buy brown bread more than white bread to be able to use both pieces of bread on the same budget.
Example #2
Suppose Noah has the habit of buying McDonald's burgers whenever going to college. However, sometimes due to unforeseen circumstances Noah also buys Subway burgers for his friends. Recently, McDonald’s increased the prices of its burger for all categories. Hence, Noah decided to maintain its burger-eating habit, albeit at subways that offer burgers at lower prices. Therefore, one can see that Noah had to change the number of burgers bought from McDonald's and increase the buying of Subway burgers due to budget constraints.
Difference Between The Price Consumption Curve And Income Consumption Curve
The main difference between the two lies explained in the table:
| Price Consumption Curve | Income Consumption Curve |
|---|---|
| In PCC, when there is any decrease in the price of the commodity at a constant budget, it gets plotted. | In the income consumption curve, the price of the commodities remains constant at constant income, and then it gets plotted. |
| Here the relative price or goods value changes. | Here the income gets freed up. |
| It changes the number of goods being bought with the income. | It changes the buying power of the consumers |
| It leads to a fall in products prices | It leads to an increase in the price of goods |
| It gets represented by the PCC. | It gets shown by the income consumption curve. |
| Derivation of the demand curve from the PPC is possible using the price consumption curve and demand curve. | It is not possible here. |
