Table of Contents
What Is Rectangle Pattern?
Rectangle pattern is a candlestick pattern that traders widely use in technical analysis to identify price movements that take place within a particular range. The pattern denotes the confinement of the price movement between two trend lines.
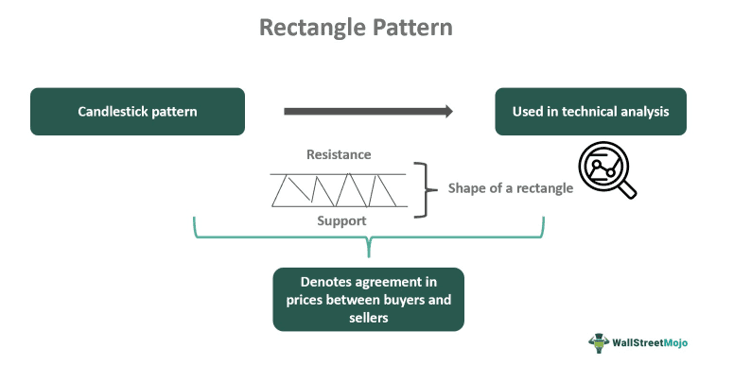
This signifies a rangebound market or a consolidation zone where the support and resistance make up the top and the bottom part of the rectangle over a long period. This indicates an overall agreement in prices between the buyers and sellers after a robust previous uptrend or a downtrend.
Key Takeaways
- Rectangle pattern is a form of candlestick arrangement that forms the shape of a rectangle in the chart.
- Traders use this pattern in technical analysis to detect the consolidation phase in stock and identify breakout signals for trading.
- In this, the prices move within a range, touching the same level of the upper trend line for resistance and the lower trend line for support.
- Traders calculate their profit levels in case of a breakout by taking the distance between the support and resistance levels.
Rectangle Pattern Explained
Rectangle Pattern is a chart pattern in technical analysis that traders identify while analyzing stocks or any other financial instrument for trading purposes. This candlestick format forms a box or rectangle-like structure within the chart due to repeated oscillation of prices within fixed support and resistance levels.
The movement of prices remains restrained within the upper and lower trend lines due to the fact that the buyers and the sellers are equally strong and in agreement with the ongoing prices. Therefore, the chart shows two parallel lines within which the candlesticks move. This occurs after an extended uptrend or a downtrend previously.
The bearish or bullish rectangle pattern also shows the indecisiveness of the bulls and the bears regarding where the market may head in the future. So, the same levels are repeatedly tested. Traders need to wait for a breakout in either direction to understand in which way the market is heading. However, the breakout may not always be sustained, and the price may come back inside the rectangle, depending on various factors that influence prices. Therefore, sometimes, the pattern shows a false breakout, which misguides traders into trading.
It is important to note that rectangle pattern design cannot be used as a standalone indicator to understand the market pattern because it may not always be accurate, as already mentioned above. Therefore, traders should use other technical indicators that show trend changes and identify entry and exit levels because they will give additional confirmation while taking trades.
How To Identify?
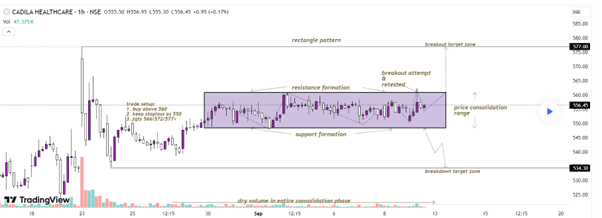
It is possible to identify and have a clear understanding of the process using a chart from TradingView. In the chart of Cadilla Healthcare, given below, the prices are moving up and down within a particular range, forming trend lines that represent support and resistance levels. It shows how the bulls and bears are pushing the prices in each other’s direction, creating a rangebound market.
The rectangle is marked and shaded in blue, and there is a long consolidation. At one point, the prices try to break out above the resistance levels, trying to form a bullish rectangle pattern, but are unsuccessful. Throughout the consolidation phase, the volume remains at a very low level, suggesting that there is not much significant movement in quantity and prices.
How To Trade?
In such cases, the traders should first identify the pattern within the chart. First, the previous trend should be identified. Then, when the prices start consolidating, traders should draw the support and resistance levels by joining the highs and the lows to form the rectangle.
Traders need to be very careful when taking a trade. They will have to either buy at the resistance level with a stop loss at the support level or, if they want to sell in case of a bearish rectangle pattern, then they need to enter the sale trade at the support level, with a stop loss at resistance. This is because trade is only possible when there is a good breakout, either above resistance or below support, with good volume. Trade during this consolidation phase will not be profitable.
To understand at what level the profit expectations should be fixed, the trader should measure the height between the support and resistance, which will be equal to the distance the uptrend or the downtrend will travel in case of a breakout in either direction. This will help in deciding the price targets.
However, it is always advisable to combine this pattern with other indicators so as to get a better confirmation.
Examples
The concept of rectangle pattern design can be explained with the help of some suitable examples, as given below.
Example #1
Jeff is a long-term investor who has been planning to invest in the stock ABC Corporation for quite a long time due to its strong financials and good prospects in the field of green energy. The stock has been in a consolidation phase for the last three months. This has created a rectangle pattern in the chart. However, on a particular day, he spots a breakout with a small green candle above the resistance level with a reasonable volume. Jeff, being a conservative investor, decides to wait for the following confirmation, which he expects to be another green candle because the RSI is also showing an upward signal above 40-level, and there is big news about the company’s upcoming green energy project to be launched very soon. After the second confirmation, he buys the stock.
Example #2
The stock of Petnonet LNG Ltd has been in a consolidation phase for three years at a stretch, and finally, it has successfully broken out of the pattern with good momentum. Traders were in a position to buy the stock at the breakout level, which would initiate a good buying session, taking the prices further up in the market. However, quite contrary to the expectations of analysts, the stock could not hold the buying strength for a long time. However, it is still above the resistance level, suggesting a strong possibility of a repetition of the upward movement very soon.
Benefits
Here are some benefits of the rectangle pattern trading.
- The pattern is relatively easy to detect since the candlesticks move within a fixed range, creating a box-like arrangement that can be drawn by joining the upper and lower points.
- The support and resistance levels are very clearly displayed in the pattern, making it easy for traders to identify the breakout levels once they occur.
- Traders can also estimate the price targets by measuring the height between the support and resistance, which is typically the length the price will travel in case of breakout.
- Novice and inexperienced traders can also easily use this pattern while trading because of its simplicity.
- It is also possible to set the stop loss and fix the entry and exit levels.
Limitations
Some noteworthy limitations of the concept are given below.
- It is not easy to take a trade while the chart shows a rectangle. This is because sometimes the prices may not reach the support and resistance level, and sometimes they may move beyond the levels, giving an impression of a breakout, but prices again return to the rectangle formation.
- False breakouts result in loss of money due to incorrect decisions, and sometimes traders may mistake a real breakout for a false signal and miss the beginning of a trend.
- The concept of measuring price targets using the distance between the support and resistance level does not always work correctly in the case of rectangle pattern trading. The prices may move more or less than the calculated target. In such cases, traders face problems booking profits.
Rectangle Vs. Head And Shoulders Pattern
Both the patterns denote price movement in charts and are widely used in technical analysis. But there are differences between them, which are as follows:
- The former forms the shape of a rectangle, while the latter forms the shape of a head in the middle with two shoulders on either side, whose peaks are lower than the head.
- The former denotes that there is a consolidation phase in the prices of the stock or any financial instrument, but the latter denotes a possibility of trend reversal.
- The price target in the case of the former is fixed by calculating the distance between the support and resistance levels. However, for the latter, the price target is calculated by taking the distance between the neckline and the peak of the head.
- For the former, the breakout happens from the support or resistance levels, either upward or downward. Still, for the latter, the breakout happens from the lowest point of the shoulder, downwards in the case of head and shoulder, and upwards in the case of inverse head and shoulder.
