Table of Contents
What Is Total Return?
Total Return (TR) refers to a technique to measure all the gains an investor receives through their investments, where both income generation and price appreciation over a given period are considered. It measures the returns generated by each investment vehicle in a portfolio.
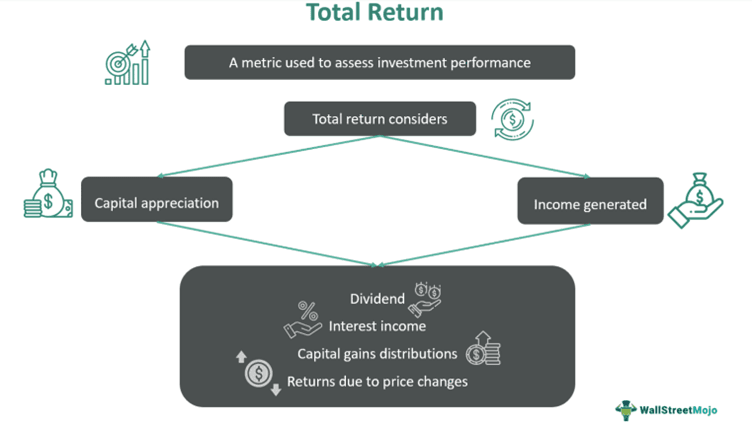
Investors consider it a key metric while evaluating investment performance as it enables them to understand how their portfolio grew over a period. It includes all the earnings or gains recorded with respect to investments, such as capital gains, interest income, distributions realized, and dividends. It is generally expressed as a percentage of the total sum invested. The value of total return can be positive or negative, reflecting an asset’s historical performance.
Key Takeaways
- Total Return (TR) is a parameter that enables investors to measure the performance of their investments in a given period.
- It maps both capital appreciation via price changes and income generation for specific timeframes.
- Investors consider TR a key metric while estimating the returns a portfolio of investments is able to generate in a given period based on which future investment decisions can be made.
- The total return formula is [(Current Value – Cost Basis + Distributions) / Cost Basis] x 100.
- It differs from yield and net returns as TR considers the total earnings over a specific period, taking price changes and income into account.
- Yield shows an investor’s annual earnings based on an asset’s current price. Net returns show the earnings an investor receives after deductions (expenses, fees, and taxes).
Total Return Explained
Total return is the comprehensive or actual rate of return generated or offered by investments in a given period. All the aspects of an asset that contribute to its performance are considered for this computation.
Its key components include the following:
- Cost basis, which is the initial purchase price
- Total income, which includes distributions, dividends, and interest payments
- Capital gains, which refer to the profits realized from asset sale
Let us discuss these components in more detail. The cost basis is the original cost of buying an asset. Any price appreciation (above the cost basis) refers to capital gain, and any depreciation (below the cost basis) means capital depreciation. The next is the total income generated by an investment during a specified period. These include distributions, dividend payments, capital gains, non-recurring special dividends, and interest income.
Distributions are derived from interest, dividend, or principal payment by the issuer of an investment. Dividends are the portion of a company’s profits that is paid to investors in cash. It may be released yearly, quarterly, or semi-annually. It can offer a steady income stream to investors. Capital gains reflect the profits an investor can earn upon the sale of an investment vehicle or asset, such as securities, real estate, mutual funds, etc.
To calculate the rate of return, one should follow the steps given below:
- Calculate the total cost of the investment, which includes purchase price, transaction fees, brokerage, or any other associated costs.
- Add other income received from the investment in a given period, which includes dividends, interest, rental income, capital gains, etc.
- Calculate the total earnings from the asset for the said period.
- Divide the total cost of the investment by the total annualized return of the investment to arrive at a percentage figure.
The total return on assets or total return to shareholders can be calculated in this manner. It also enables investors to make better decisions about their investment strategy and style, including portfolio diversification and asset allocation.
The above steps can be represented as a mathematical formula:
Total return formula
Total return = x 100
One must be careful not to confuse TR with a total return swap, which is a two-party contract for exchanging returns obtained from a financial asset.
Examples
Let us understand the topic using a few examples below.
Example #1
Hannah, an investor, buys 100 shares at $100 per share of LesterSwift Motors. She held them for 10 years and received $1 as a dividend per share per year. After 10 years, she sold the shares at $150 per share.
| Total investment by Hannah to buy a hundred shares | $10,000 |
| For every year, Hannah received a total dividend | $100 |
| Therefore, the total dividend received in 10 years | $1,000 |
| After Hannah sold her shares, she received | $15,000 |
Therefore, the TR received on investment = Total dividend + Total selling price
= $1,000+$15,000 = $16,000
Hence, the TR Hannah received = $16,000
TR in percentage = 15,000-10,000/10,000*100 = 5,000/10,000*100 = 50%
Hence, Hannah obtained 50% TR over ten years or a 5% return every year on her investment.
Example #2
A January 2024 report published on Fintech Futures shows the outlook of the mutual fund industry in the United States for the years 2023 through 2028. The assets under management (AUM) are estimated to increase from USD 32.96 trillion in 2023 to USD 40.53 trillion by 2028. This 5-year forecast is based on the estimated 5-year returns anticipated on various mutual funds.
Another noteworthy aspect of investment that this article highlights is the extent and variety of mutual fund avenues investors in the United States have, with asset classes like stocks, bonds, market caps, etc., across various sectors and industries being available for consideration. It further explains how these funds are actively managed to ensure fruitful investment outcomes, both short- and long-term. Given this input, let us understand why investors in the US might consider such reports crucial while making mutual fund investment decisions.
While making mutual fund investment decisions, investors typically undertake comprehensive performance evaluation alongside a detailed comparative analysis of various mutual funds that might help them build a solid portfolio. Given the correlation between total returns and historical performance, such reports outline two important things for investors: income generated over the years and long-term investment planning potential.
In short, investors can use such reports and prepare total return charts to gain insights into total return on investment and make suitable investment decisions.
Total Return vs. Yield vs. Net Return
In this section, let us study the differences between total returns, yield, and net returns.
| Basis | Total Return (TR) | Yield | Net Return |
|---|---|---|---|
| Definition | It measures the overall performance of an investment. | Yield is the income an asset generates in a year based on its current value. | Net return is the amount an investor receives after all expenses and taxes have been deducted. |
| Scope | It includes both price changes in assets and the income produced by such assets. | It includes the returns an asset generates over a year relative to its current value, which can be reinvested to amplify future returns. | It is the total cost of acquiring an asset. |
| Components | It comprises money received through dividends, interest payments, capital gains, and any other earnings or distributions. | Expressed as a percentage, yield is a number that shows the annual earnings made through an investment. | Fees, expenses, and taxes are deducted to arrive at net returns or actual returns earned in a given period. |
| Investment Horizon | TR is computed over a given period, which can be both short- and long-term. | Yield typically applies to a period of one year. | Net returns can be computed monthly, quarterly, or yearly. |
