Table of Contents
What Is Tri-Star?
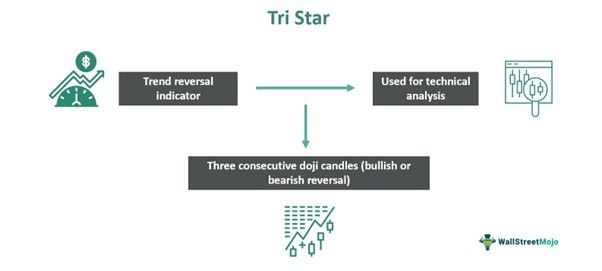
The tri-star is a technical indicator that traders widely use to detect trend reversal while trading in a financial instrument. This candlestick pattern is not very common but marks the end of a trend or the beginning of a new one.
It consists of three doji candles placed consecutively, which may denote either a bearish or bullish reversal. However, such a pattern is more effective if it appears near a support or resistance level because this gives stronger confirmation to traders and helps them make more informed decisions.
Key Takeaways
- Tri-star is an indicator used in technical analysis using charts in any trading platform that denotes trend reversal.
- In this pattern, three doji candles appear side by side, marking the end of the previous trend and the beginning of a new one.
- Traders use it, preferably if they appear near resistance or a support level so that the trade confirmation is stronger.
- Since it appears at the end of a trend, it can be easily spotted.
- However, it should be used with other relevant indicators to ensure the reliability of the entry and exit positions.
Tri-Star Doji Pattern Explained
The tri-star candlestick pattern is popular among traders who try to detect any change in trend and use the opportunity to profit from the financial market.
In this pattern, three doji candles appear side by side on the chart and can be viewed using any trading platform. Each candle has its own significance, and the trader must understand it with clarity.
The first candle in a bullish or bearish tri-star pattern shows indecisiveness in the market, which means investors are not sure of their next move. The bulls and bears are equally strong at this point. Next, doji denotes how much gap there is between the previous trend and the possibility that it is about to take place. The third shows the actual market sentiment, which is the trend change.
There is also an arrangement pattern for the same. The middle candle will be above the first and third in case of a bearish market, and it will be below the first and third in case of a bullish market.
Even though it is widely used, it is advisable to use it in combination with other indicators that denote trend change because it is considered a weak pattern as compared to others.
How To Read?
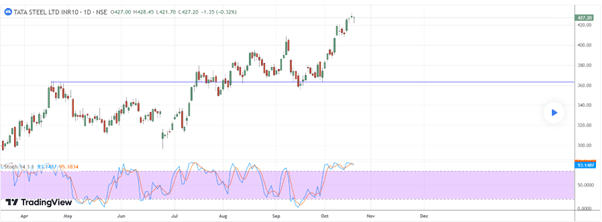
A study of the TradingView chart, which shows this pattern, will provide a better insight into the concept. The bullish tri-star pattern at the end of Tata Steel's chart is given below. Even though such a pattern is quite rare, it presents a good opportunity to understand the market movement.
At the very end of the chart, three consecutive doji are visible. In the arrangement, the middle doji is above the first and third, indicating a bearish tri-star pattern trend reversal. Therefore, Tata Steel's stock may face a down-move in the near future. Here, the bullish trend that had continued for the last few sessions is likely to see a change in the opposite direction. Traders may short the stock at this stage and select a stop loss at the upper tip of the wick of the middle doji.
How To Trade?
There are a few steps involved in trading using this pattern, as given below:
Step #1 – The pattern is very rare, but a skilled and experienced trader will be able to spot it since it is clearly visible at the end of a trend. In case the middle doji is below the first and second, it denotes a bullish reversal, and above the first and third denotes a bearish one. Therefore, the trader has to decide whether they wish to go long or short of the stock.
Step #2 – The next step is placing the trade. In the case of a bullish market, the trader may go long and place a stop loss at the lower end of the tip of the middle dojo’s wick. For bearish trend reversal, the stop loss will be at the topmost tip of the middle doji’s wick.
Step #3 – Next is tracking the price movement. They should ideally use a combination of other indicators like MACD, RSI, and Stochastic along with the tri-star pattern.
Step #4 – Finally comes profit booking. Traders can monitor the market and book profits as per their selected levels without waiting too long. Typically, they should watch out for the next possible trend change and exit the market at that point.
Examples
Here are some examples that will give better insight into the concept.
Example #1
Jack is an investor who spotted a tri-star pattern in the stock of ABC Inc., in a daily chart. He saw that the middle doji is lower than the first and the third. Therefore, the stock may go up in the future. It has already been showing a downtrend for 3 months and then was rangebound for the last four months. Jack invested in 100 stocks with proper stop loss in place at $20 per stock. Within the next two months, the stock rose to $45. At this level, Jack booked a profit of $2500 and exited the stock.
Example #2
Mac is another investor who is conservative. He does not prefer taking big risks. He spots a tri-star pattern in the stock of DEF Corporation after a continuous downtrend for the last 6 months. The pattern shows the middle doji to be lower than the first and third doji, meaning the market may move up. However, he decides to wait for other indicators to show the same result. But on the fourth trading session, the market again shows a downmove. Thus, tri-star is not always very reliable, and traders should get enough confirmation and then take a trade to earn profit.
Benefits
Some noteworthy benefits of the pattern are as follows:
- It is a good indicator of trend reversal. The trader gets an idea about their entry and exit points after combining it with other indicators for better confirmation.
- It is not only suitable for stocks but also for commodities, currencies, etc. Therefore, it can be used across various types of markets in the financial world. This proves its versatility.
- It is quite easy to identify, provided the trader has a proper idea about the pattern and how it looks. The trader has to look at the end of the candlestick arrangement in a chart to see the pattern and decide the direction of trend reversal.
Drawbacks
Here are some drawbacks of the concept.
- As already pointed out previously, this cannot be used as a standalone indicator because it also has the tendency to break in between, making it not so reliable. Therefore, some traditional indicator patterns should be used.
- It is rare in nature. It does not occur too often. Thus, traders cannot depend on it and expect it to happen whenever there is a possibility of a trend reversal. It is seen only if the market is very volatile. So traders cannot entirely rely on them.
- It does not measure the magnitude of the reversal. It can only signify the direction. Thus, the duration of the trend change and the strength of the change are not indicated in this pattern.
