Table of Contents
What Is Bullish Flag Pattern?
Bullish flag pattern is a candlestick formation over a few trading sessions, which denotes an uptrend in the market which can continue in the future. The formation appears like a flag, with a long pole that shows the uptrend.
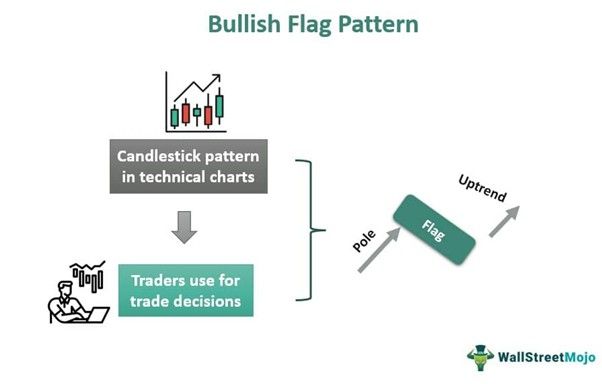
The pole is a vertical increase in prices over some time, and the flag is denoted by a rectangular candlestick arrangement, which may tilt a bit downwards. After the flag, there is a breakout from the top of the flag, which is usually very strong and has good volume. Traders widely use it for technical analysis.
Key Takeaways
- Bullish flag pattern is a combination of up move and continuation in a chart that traders commonly use to identify a bullish trend.
- This pattern happens over a few trading sessions, where a long pole is visible, signifying a steady uptrend. Then, a flag, typically facing downwards, represents consolidation over a period.
- The pattern gives a positive breakout on top of the flag after a few trading days, which is a powerful move.
- During consolidation, the volume comes down and later increases once there is a breakout.
Bullish Flag Pattern Explained
Bullish flag pattern is a combination of candlesticks, forming a pole and then a flag in the technical chart. Traders commonly use this formation to identify uptrends in the future and make critical trade-related decisions.
The pole in a bullish flag chart pattern is a candlestick arrangement, which denotes a steady rise in the prices for the financial instrument, after which there is a period of consolidation, denoted by the flag. During the flag stage, the volume of trade is low, but it gets a sudden boost once there is a breakout from above.
Traders often use this pattern to decide on their entry position with a stop loss to limit the losses in case of adverse market movements. However, this formation also helps in deciding the target price during trade.
In case the inverse of the bullish flag pattern chart situation happens, it is called a bearish flag pattern, which is a signal for a downtrend in the future. However, traders can easily recognize the bullish pattern in any charting platform. They should wait for a confirmation in the form of a breakout at the end of the flag with a green candle to ensure that it is the beginning of another bullish trend.
How To Identify?
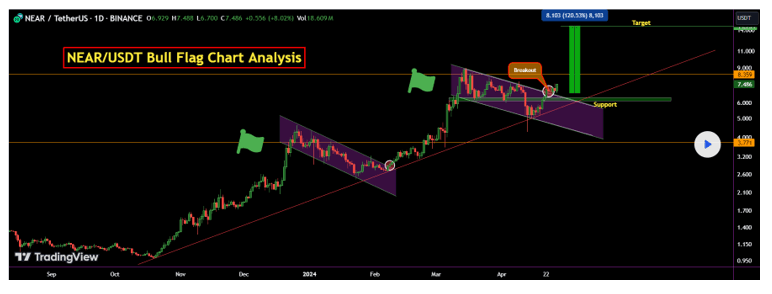
It is possible to identify the bullish flag chart pattern using a chart from TradingView. In the chart given below, two such bullish flag patterns are visible clearly, each having a long pole and then a flag. Each ends with a slight bullish breakout and resumes its journey upwards. The pole is a steady set of green candles showing an uptrend, and the flag is a somewhat rectangular consolidation of candlesticks facing downwards.
This formation for bullish flag pattern stocks is easy to detect. It is beneficial in making trade decisions because it shows both an entry and a price target level so that the trader can take a trade after proper confirmation.
How To Trade?
This section will elaborate on the bullish flag pattern target and trading strategy typically followed when such a pattern appears within a chart. As already explained, this is a candlestick arrangement, which signifies an upmove in the market. So, the pole itself is a set of continuous bullish candlesticks, and then the flag appears.
The traders are confirmed that there will be an uptrend due to the green breakout candle that they see at the end of the flag. That is the support or the entry level for them. They can decide to enter the market and take a long position in the financial instrument that they are planning to trade in because now the sellers are slowly losing their strength, and buyers are capturing the market.
It is also possible to decide on the bullish flag pattern target price by calculating the height of the pole and placing it on top of the breakout to fix the price level. This will be a price at which the trader should be ready to exit the trade.
In this pattern, after the breakout, the volume is also of great significance. The breakout happens, and subsequent bullish candles appear along with good volume, which is again a sign of an uptrend in the market.
Stop loss is equally important in this case. The trader should have a stop loss, which should be placed ideally at the lowest level of the flag pattern. If the market does not move as predicted, the trader can exit on time without making a considerable loss.
Examples
Here are some suitable examples to understand the concept of a bullish flag pattern chart in detail.
Example #1
Mac is a long-term investor who has decided to invest in the stock of ABC Ltd because the company is financially strong and has bagged some excellent and profitable projects at a global level. However, he is looking for a good entry point since the stock is currently in a range-bound consolidated market representing a flag after experiencing a pole movement with back-to-back green candles a few months ago. Suddenly, he spots a green breakout candle along with a reasonable volume, which marks the entry point for an uptrend. He places the stop loss at the support level of the flag to control the risk of loss. He targets for an exit point at the level that is equal to the length of the pole.
Example #2
Ashok Leyland, the Indian automotive manufacturer, has broken out of the bullish flag pattern and is now aiming for an all-time high in the market. The stock has been rangebound inside the flag pattern for a long time, and now this sudden positive change has invited traders to take a long position with a very positive outlook on the stock in the near future.
Bullish Vs Bearish Flag Pattern
Both the above patterns are widely used candlestick arrangements to decide on the type of trade depending on the market direction. But there are some points of difference between them, which are as follows:
- The bullish flag pattern stocks are a signal for an uptrend in the market or that particular financial instrument, but the latter is a signal for a downtrend.
- Both will show a flag and a pole, but the former will show the pattern moving upwards, and the latter will show the pattern moving downwards.
- The former will show a breakout in the form of a green candle at the top of the flag as a confirmation of an up move, and the latter will show a breakout in the form of a red candle as a confirmation of a down move at the bottom of the flag.
- In the case of the former, the stop loss should be placed below the lowest level of the support of the flag, and in the latter, the stop loss should be placed above the highest level of the resistance of the flag.
- For the bullish flag pattern stocks, the flag will typically face downwards, and for the latter, the flag will typically face upwards.
