Forecasting Methods: Using Decision Goals to Pick the Right Model Using Median Error and Quartiles
Table of Contents
Introduction
Forecasting isn’t just about getting the most accurate number. In real business settings, you forecast so you can decide how much inventory to buy, how many agents to schedule, what budget to approve, or which product variant to ship.
That’s why a decision-first approach matters. You shouldn’t choose summary metrics (like mean vs. median) only based on how skewed the data is—you should select them also based on what decision you’re optimizing. The same logic applies to forecast evaluation: the best forecasting method depends on the outcome you care about (total cost, typical performance, or tail risk).
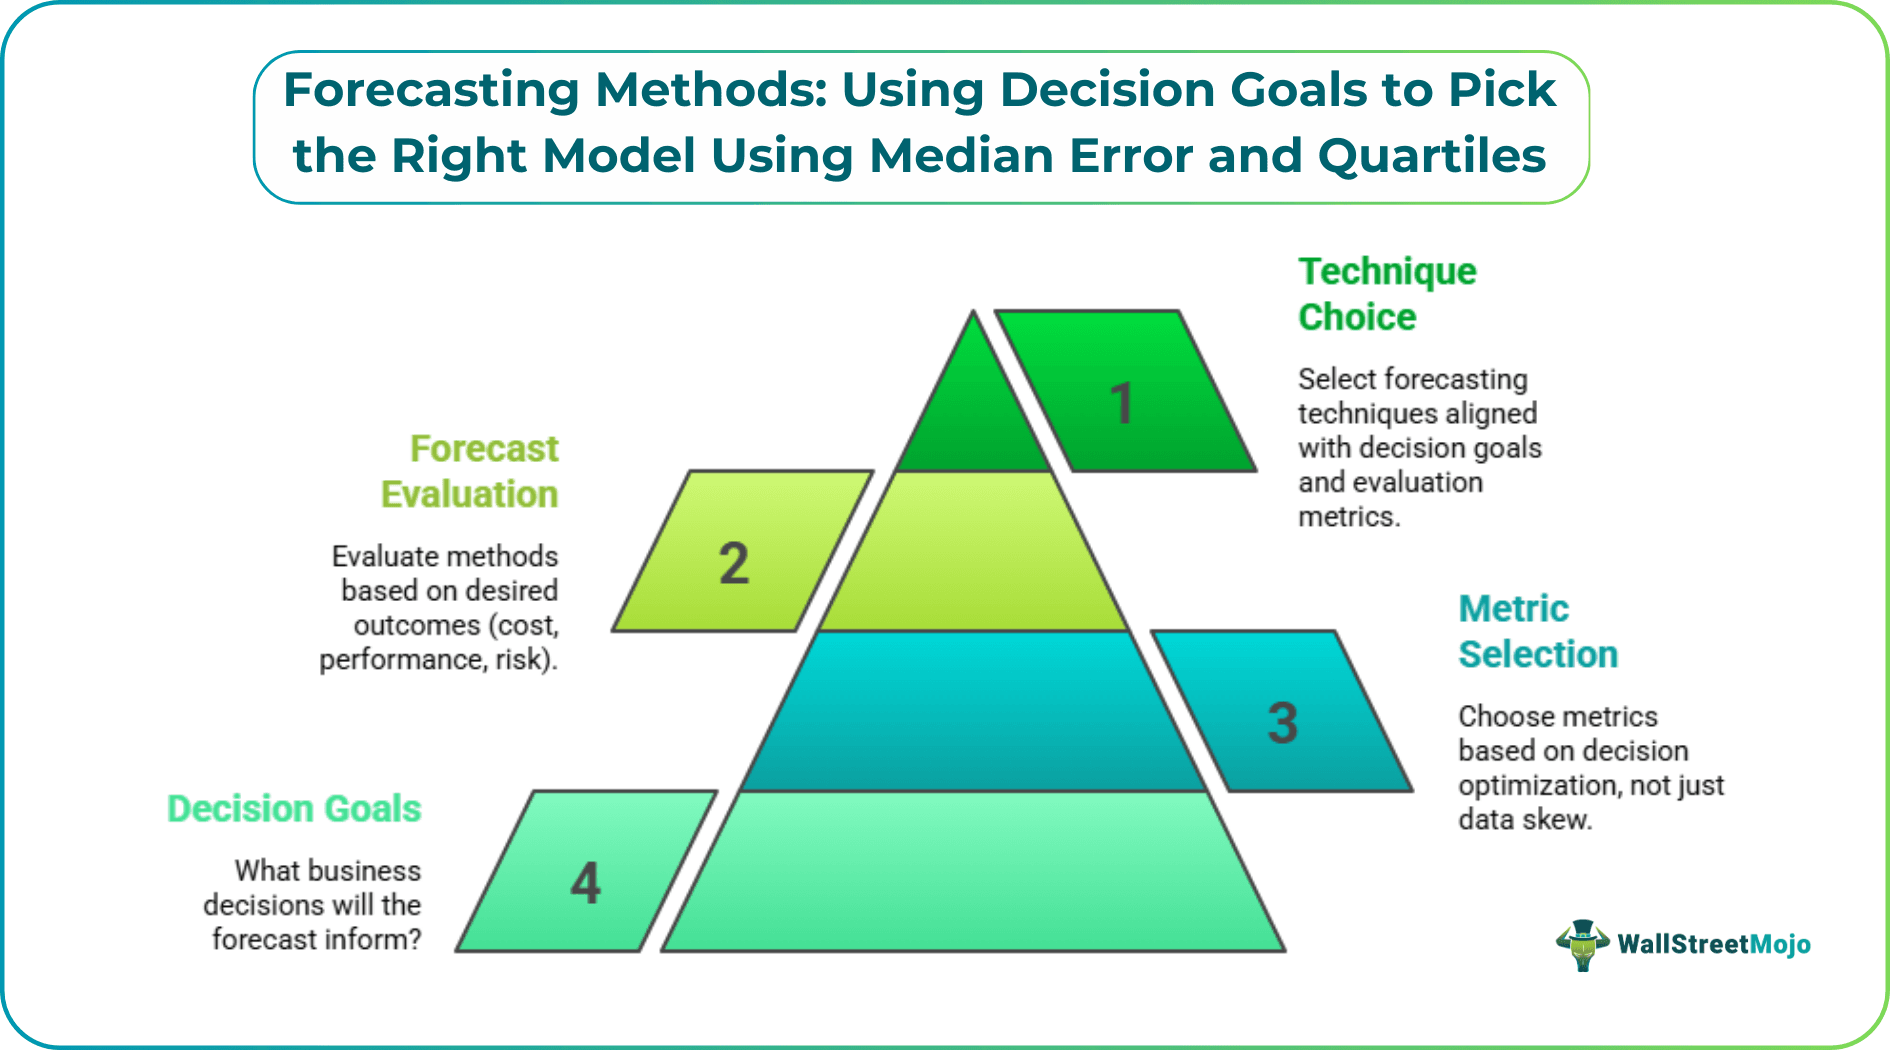
This guide shows a practical way to choose among forecasting techniques in operations management by pairing your decision goal with the proper evaluation metrics—especially median error and quartile bands—so you don’t optimize the wrong thing.
Key Takeaways
- The best forecasting method depends on the decision (inventory, staffing, service level, budget), not only on accuracy scores.
- Use mean-based metrics when you’re optimizing a total (total cost, total revenue impact).
- Use median error when you care about the typical SKU, branch, or day (robust to outliers).
- Use quartiles (Q1/Q3) of errors to manage tail risk and set escalation thresholds.
What Forecasting Is Trying to Solve (Decision First)
Most teams start demand estimation and forecasting by asking: "Which model has the lowest error?"
A better starting question is: "What does a forecast error cost us?" As highlighted by the Institute of Business Forecasting & Planning (IBF), forecast error and bias can be problematic for the entire organization. For example:
- Over-forecasting increases the cost of inventory, transshipment, and obsolescence, while under-forecasting increases procurement costs and lost sales due to stock-outs.
- In staffing, under-forecasting can lead to long wait times and service-level agreement (SLA) breaches.
- In budgeting, over-forecasting can tie up cash we could deploy elsewhere.
Once you define the decision, the right metric (and often the right model class) becomes much clearer.
Common Methods of Forecasting (Quick Map)
If your keyword is methods of forecasting or forecasting methods in operations management, here’s a simple map you can use without turning this into a textbook list.
- Naïve forecast: next period = last period. Baseline to beat.
- Moving averages: smooth short-term noise; good for stable series.
- Exponential smoothing: similar to moving averages, but weights recent data more.
- Trend + seasonality models: useful for monthly/weekly patterns.
- Causal / regression models: include drivers (price, promotions, macro factors).
- Time-series models: capture autocorrelation patterns.
- Machine learning: helpful when you have many drivers and nonlinear effects.
You can use any of these, but how you select them should match your decision goal.
Step 1: Define Your Decision Objective (The "Why")
Use one of these three buckets. Most business forecasting decisions fit inside them.
Objective A: Minimize total cost (inventory + stockout + capacity)
Here, you care about the total impact across many units.
Example decisions:
- "How much safety stock should we hold across all SKUs?"
- "What’s the total budget risk if we’re wrong?"
Hint: total-impact decisions often require mean-based thinking because totals are additive.
Objective B: Improve typical performance (what most SKUs/branches experience)
Here, you want the forecast to be reliable for the typical item, not dominated by a few extreme products or periods.
Example decisions:
- "How accurate are we for the typical store?"
- "Is our forecast generally usable for most SKUs, not just the high-volume ones?"
Hint: this is where median error is usually more meaningful than a mean.
Objective C: Control tail risk (avoid the worst 25% outcomes)
Sometimes the average error isn’t the problem—the worst weeks are.
Example decisions:
- "How often do we blow our staffing plan?"
- "What’s our risk of missing SLA when demand spikes?"
Hint: Tail risk decisions are perfect for quartiles (Q1/Q3) and escalation rules.
Step 2: Pick the Metric by the Decision (Mean vs Median vs Quartiles)
Forecasting techniques in operations management are often compared using metrics such as MAE, RMSE, and MAPE. These are useful—but they don’t fit every decision equally well.
If you’re optimizing totals: use mean-based, cost-weighted metrics
Use mean-based metrics when you’re answering "How much, in total?"
Common choices:
- Mean Error (ME) for bias: average of (Actual − Forecast)
- MAE (mean absolute error)
- RMSE (penalizes big misses more)
- Weighted MAE or cost-weighted loss (best when SKUs have different costs)
This approach aligns with the decision-first principle: when the decision is about a total, mean-based approaches often match the objective more directly.
If you care about the typical case, use median error
If your dataset has a few extreme periods (promotions, outages, rare spikes), mean errors can overreact.
Two practical metrics:
- Median Absolute Error (MedAE): median of |Actual − Forecast|
- Median Signed Error: median of (Actual − Forecast) to detect typical bias.
If you care about tail risk, use quartile bands (Q1/Q3) of errors
Quartiles show you how errors behave across the distribution of outcomes.
Useful ideas:
- Q1 and Q3 of the signed error to see the typical spread and direction.
- Q3 of absolute error as a bad-but-not-catastrophic benchmark.
- Escalation rule: If absolute error exceeds Q3, trigger review.
Step 3: Use Quartile Bands as a Forecasting Risk Dashboard
Here’s a simple dashboard that works well for business reviews:
- Median signed error → typical bias (are we usually high or low?)
- Median absolute error → typical accuracy
- Q1 and Q3 of signed error → dispersion of misses and whether downside risk is bigger than upside risk
- Q3 of absolute error → where painful errors begin
This is also how you keep forecasting model selection from becoming a single-number contest.
Worked Example: Picking the Metric (and the Model) by the Decision
Imagine the weekly demand for a SKU (units). You tested two forecasting methods:
- Method A: moving average
- Method B: regression with a promotion flag
You record signed errors (Actual − Forecast) for 9 weeks:
Method A errors:
-40, -15, -10, -5, 0, 5, 8, 12, 60
Method B errors:
-25, -12, -8, -3, 1, 4, 7, 9, 20
Decision 1: I want typical performance across SKUs
Compute median absolute error (you can use a median calculator).
- Method A absolute errors: 40, 15, 10, 5, 0, 5, 8, 12, 60 → median = 10
- Method B absolute errors: 25, 12, 8, 3, 1, 4, 7, 9, 20 → median = 8
Method B wins for the typical case.
Decision 2: I must avoid bad weeks (tail risk)
Compute Q3 of absolute error, i.e., 75th percentile of |error| (you can use a quartile calculator):
- Method A absolute errors sorted: 0, 5, 5, 8, 10, 12, 15, 40, 60 → Q3 = 15
- Method B absolute errors sorted: 1, 3, 4, 7, 8, 9, 12, 20, 25 → Q3 = 12
Even without perfect quartile math by hand, you can see Method A has a much heavier tail (40, 60). Method B’s upper tail is smaller (20, 25). If your service level depends on not blowing up in peak weeks, Method B is safer.
Decision 3: I’m optimizing total cost across volume
If a few huge weeks dominate cost (overtime, expediting, lost margin), then mean-based or cost-weighted metrics matter more. Method A’s +60 error week could be expensive. A cost-weighted loss will penalize it more harshly.
How to Do This Fast in Excel (Practical Workflow)
You can apply the decision-first approach to any dataset in minutes.
- Put Actual in column A, Forecast in column B
- Signed error in C: =A2-B2
- Absolute error in D: =ABS(C2)
Then compute:
- Median absolute error: =MEDIAN(D:D)
- Median signed error: =MEDIAN(C:C)
- Quartiles of signed error: =QUARTILE.INC(C:C,1) and =QUARTILE.INC(C:C,3)
- Quartiles of absolute error: =QUARTILE.INC(D:D,3)
Frequently Asked Questions (FAQs)
Which forecasting method is best in operations management?
Should I always use median error because it’s robust?
What if different metrics pick different winners?
How do quartiles help beyond "median vs mean"?
Conclusion
More than choosing the more accurate method of forecasting, the real skill is in selecting the approach that fits the decision you’re making. Pick the decision first, then the metric, then the model.
If you optimize totals, mean-based (often weighted) metrics matter. If you care about the typical SKU or branch, median error is usually the most honest score. Finally, you can use quartile bands to give you a simple risk dashboard if you care about service levels and worst-case weeks.
