Table of Contents
What Is Mass Index?
Mass index is an approach related to the technical analysis of financial instruments while trading in the market. Donald Dorsey invented this approach based on the fact that markets reverse after wide ranges.
In this approach, the traders can keep track of a ranging market and the gap between the high and low price levels and estimate the point after which prices will show a trend reversal, either up or down. However, it does not show the direction or momentum of the reversal.
Key Takeaways
- Mass index is an indicator used in technical analysis, where price gaps are used to indicate the point after which there may be a trend reversal in the market.
- This concept was invented by Donald Dorsey, who analyzed that prices reverse after wide ranges, which can be used to predict reversals.
- However, it does not specify the direction or strength of the change.
- This volatility indicator is an excellent tool to help traders make trading decisions at the correct time, but it should be combined with other trend reversal tools for better results.
Mass Index Explained
Mass index is an indicator used in the technical analysis of various financial instruments traded in the market. Traders use it to assess the level or point after which there is a possibility of price reversal and accordingly make trade decisions.
Price reversals are essential because they act as a guide to identify levels at which the market will either go up or down. This data is used to decide the buy and sell levels and use the volatility to make profits.
Even though this mass index indicator is an excellent tool to identify turns in prices, it does not point in which direction the price will go and up to what level. Thus, to understand the direction and momentum, the trader needs to use other indicators. It is not an oscillator because its range is beyond +1 and -1.
It is necessary to decide the number of periods that will be used to calculate the same. Based on this period, the price differences between highs and lows are taken to calculate the exponential moving averages (EMA) used in the calculation.
Donald Dorsey, who invented this concept of mass index indicator, stated that this helps day traders understand how the prices behave before reversals and uses it to mathematically calculate volatility levels and assess when the trend will change based on the daily price range.
How To Interpret?
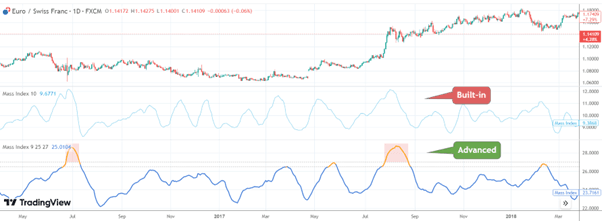
The concept of mass index trading can be explained using a chart from TradingView. In the chart below, the price movements in the form of candlestick patterns are shown at the top of the chart, and the mass index indicator appears at the bottom.
Here, it is clearly visible that the levels at which the prices move up or down to a significant extent are the ones at which the indicator is also showing a significant rise, shaded in red. When the volatility is less, the indicator is also stable. Therefore, it is easy to understand that the indicator will shoot up in case of volatility or widening of price ranges and remain more or less at the same level when fluctuation is limited.
However, traders should also note that the mass index is rising both for the uptrend and the downtrend. Therefore, it does not give a signal of direction or strength of price change.
How To Trade?
Here are the different steps regarding how to trade in the market using this indicator.
- The reversal bulge is the main sign that the range is already at an extreme level, and now there will be a price change.
- The EMA used in the calculation of the line estimates whether the trader should go for a long or short position.
- Typically, a 25-day period is ideal for the indicator with a 9-period EMA.
- Now, the trader should keep track of price ranges during mass index trading and notice the points at which it is making a wide range.
- Next, combine the reversal bulge with the EMA.
- Now, each bulge will indicate a reversal. So when the EMA is downwards, it is time to buy, and when the EMA is upwards, it is time to sell or go short in the market.
- However, the trader should also combine it with other indicators and a stop loss to manage risk in case the price does not move in the anticipated direction.
Examples
Here are some suitable examples to understand the concept.
Example #1
The stock of ABD Ltd has been moving within a range for the last six months. However, as per the Bollinger Band analysis, the range is very narrow, and there is every chance for the stock to show a breakout on the positive side due to its acquisition of a very profitable construction project. A day trader, James, used a mass index indicator to determine a possible point of reversal and detected that the index line was showing a sudden bulge at a particular point, which was confirmed the next day with a big green breakout candle on the upside. James used this level as an entry point for the long position for this stock.
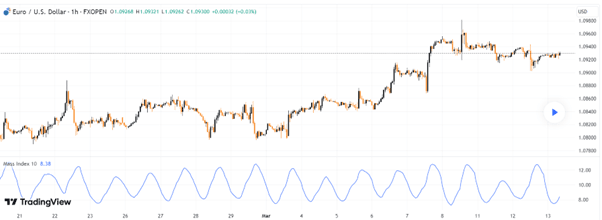
Example #2
In the chart below, the mass index line shows a lot of up and down movement. However, it is noticeable that it shows a good upmove when the volatility of the price range is greater, and the index falls or shows a slight upward bulge when the volatility is negligible. Therefore, the movement of the indicator is easy to interpret and use.
Benefits
Some benefits of the concept of mass index stocks are as follows:
- It is helpful for intra-day traders because it gives a clear visual representation of possible price reversal for the short term.
- Since it uses a mathematical formula, there is less chance of any error or bias, and it becomes more reliable.
- Using volatility to estimate trends and reversals is a straightforward way to trade. Therefore, it is easy to understand and interpret.
- The market tends to follow a pattern and repeat it. Thus, this indicator helps identify this pattern, which makes it easy for traders to develop an early trading strategy.
Limitations
Some limitations of the concept are given below:
- The most critical limitation of mass index stocks is that it does not state the direction of the strength of the reversals. It simply points out that there is a possible direction change coming soon.
- This is considered a leading indicator, which means the line rises before the actual change takes place. This may misguide the traders who may be in a hurry to take trade immediately without waiting for a better confirmation.
- It is not a standalone indicator and has to be used with other widely used trend analysis indicators, like the MACD or the RSI, for better results.
