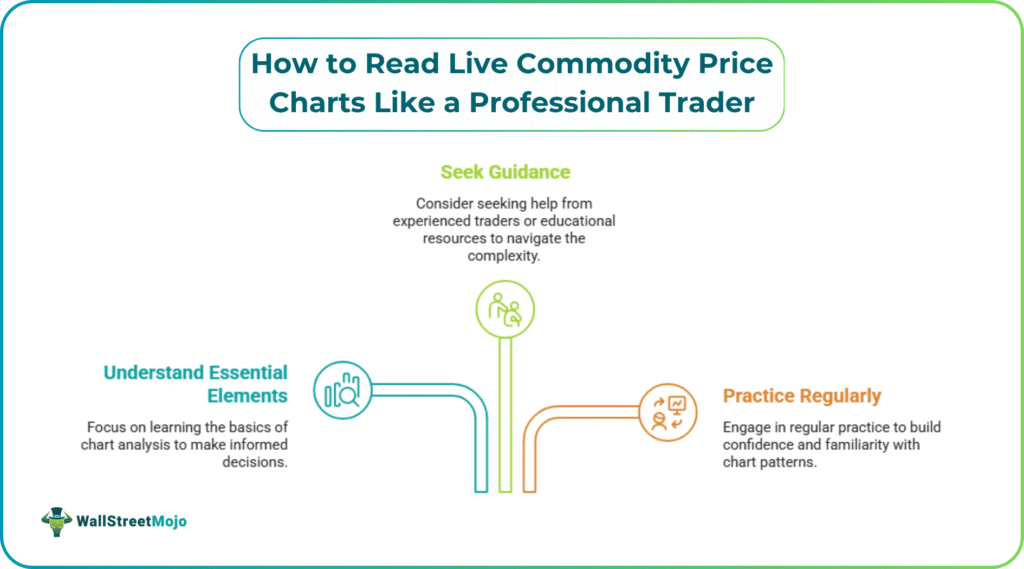
Introduction
When it comes to trading on a commodity chart for the first time, it can be quite overwhelming. Blinking lights and lights that seem to be in patterns on the indicator with no logic, the prices that seem to move, it’s a lot to take in. But the information is organized and – crucially – teachable. This article explains the essential elements of chart analysis that are important before taking any educated guess as to where a commodity market is headed.
What Live Commodity Price Charts Are Actually Telling You
In the commodity markets, live commodity prices are the result of the constant buying and selling of commodities on major exchanges, such as crude oil, gold, wheat, copper, natural gas, and dozens of other commodity markets. That raw activity is translated into a chart which shows where the price went, when, and how hard.
When it comes to commodities, there are many different factors that can affect the market at the very same time: seasonal buying and selling cycles, supply and supply disturbances, geopolitical events, macroeconomic data – you name it. The chart does not describe the reason for a move – it shows the cumulative effect of those moves. It is this behavior that is recorded, and all chart-based analysis is built upon.
But before getting into the meat of things, one practical aspect needs to be discussed: commodity charts use different data from different platforms. Often, prices from futures contracts, the spot market and CFD trading platforms will not match, especially in the time period leading up to a contract’s expiry. You don’t have a choice about what your chart is representing; it affects your interpretation of the data you display.
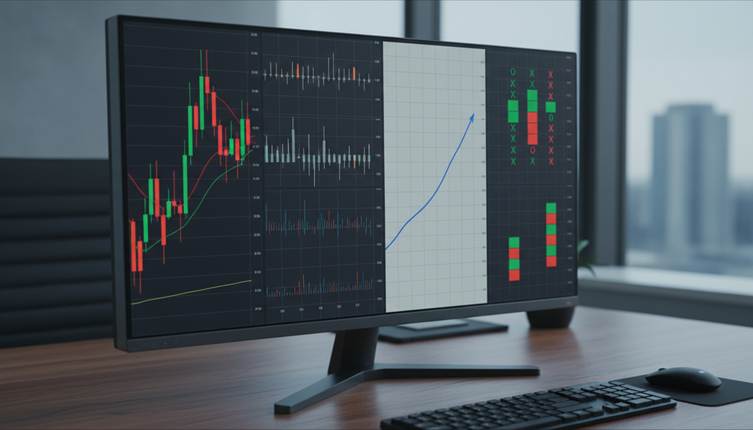
Chart Types Used in Commodity Analysis and What Distinguishes Them
The format of the chart you use reveals what you can and can’t see in the price data. Each format highlights various aspects of market action and it is worthwhile to master it before using indicators or pattern analysis.
#1 – Candlestick Charts
The most widely used method of trading in commodities. Candlestick charts show four data points for each period: open, high, low and close. The body represents the range of the session and the wicks indicate the high and low points. This is because the combination allows them to see the direction of the bias and intraperiod volatility at a single glance, and that is why most professional traders have this setting as their default.
#2 – Bar Charts (OHLC)
The same four data points are plotted in a small vertical bar chart with a small tick on the left for open and a small tick on the right for close. Although not as easy to understand as candlesticks, they are still widely used in many institutional futures trading floors where data density outweighs accessibility.
#3 – Line Charts
Line charts only show the closing price without any intraperiod movement. They’re good for analysis of long-term directional trends and historical price levels that are devoid of “noise” from the session level but have the drawback of reduced granularity.
#4 – Point and Figure Charts
Point and figure charts do not show time as a factor at all and only record price movements in excess of a predetermined amount. They have a long history in futures trading for determining breakout levels and as a filter to remove smaller price fluctuations, which is a handy way to look at the supply-demand relationship that is not always covered in introductory material.
#5 – Renko Charts
Renko charts only print a new block based on a price moving by a defined price increment in a given direction. On volatile commodities, such as crude oil or natural gas, they can help to better understand the direction of the trend, eliminating a lot of smaller oscillating movements. The inherent drawback of that smoothing effect is that it slows down reversal signals.
Chart type comparison:
| Chart Type | Time-Based | Data Points Shown | Best Applied To |
|---|---|---|---|
| Candlestick | Yes | Open, High, Low, Close | General price action analysis |
| Bar (OHLC) | Yes | Open, High, Low, Close | Institutional and futures markets |
| Line | Yes | Close only | Long-term trend visualization |
| Point & Figure | No | Price movement only | Breakout and level identification |
| Renko | No | Price movement only | Trend clarity in volatile markets |
There is an analytical function to each format, and an understanding of when to switch from one to another is an art form in itself.
Technical Indicators Commonly Applied to Commodity Charts
Technical indicators are the analysis of price data transformed into signals that can help determine momentum, trend strength, and possible turning points. They are used for a reason, but each indicator reflects past price action, and as such, there is some delay to real-time price action. New 2026 Quantitative research shows that some technical indicators have statistically significant patterns in commodity futures, but the effectiveness of these patterns in trading is highly dependent on the commodity and time scale investigated.
There are several indicators that we see in commodity chart analysis:
- Moving Averages (MA). Filter out price “noise” over a specified lookback window and reveal the price trend. The most commonly tracked moving averages among commodity markets are the 50-day and 200-day averages.
- Relative Strength Index (RSI). Measures how much momentum is on a 0-100 scale. Values exceeding 70 or below 30 indicate stretched situations, but a commodity market with a strong trend can remain in those ranges long after they signal a stretched situation.
- MACD. Identifies momentum shifts between two moving averages. Used to check that a current trend is still in force, versus whether it could be running out of steam.
- Bollinger Bands. Normal deviations that expand during volatility and narrow during quieter times. In commodity markets, extended periods of narrowing have historically given way to swift directional shifts – in either direction.
- Average True Range (ATR). Measures fluctuations in the average price over a specific time period. Especially in commodities, which may experience significant price swings from day to day, ATR can be useful in figuring out the magnitude of the typical daily swing versus an unusually large one.
It is common practice to use a combination of indicators. However, too many can detract from objective clarity as much as add to it, with any layers of interpretations that are added on conflicting with one another.
Reading Price Patterns and Their Practical Context
Price patterns are formations that appear in the chart on prices that have been recorded over the decades from observing the market. They are not guarantees or predictions but rather indications or tendencies of the behavior of market participants and as such, their value is in providing a reference point, not certainties.
#1 – Trend Lines and Channels
Trend lines are drawn to show the rate at which the market is moving in a certain direction, either connecting the successive higher lows in an uptrend or the successive lower highs in a downtrend. A price channel is formed by a parallel line across the opposite swing points. These structures will form and develop naturally when the supply-demand dynamics are stable, but can easily be disrupted with very little notice by a sharp fundamental event like an unexpected crop failure, a production cut, or a major weather event.
#2 – Support and Resistance Zones
Support is a level that, in the past, a decline was successfully halted by buying and resistance is a level that a rise was effectively blocked by selling. These are areas, not exact levels and have more analytical significance if seen on two or more timeframes at the same time. One of the most frequently observed occurrences in commodity futures is called “role reversal”: When support breaks, the price continues to the next level of resistance and vice versa, which traders in all markets watch for.
#3 – Volume as Contextual Evidence
Volume is an essential piece of the puzzle in price analysis, validating the true level of conviction behind market movements. The CME Group exchange data reveals regular surges in trading volume at the exact times of fundamental releases, namely USDA crop and EIA petroleum reports. These are high-volume sessions, and they are directly connected to the most influential times of price discovery, as algorithmic funds begin to take over trading. When checking the price action for the same session, comparing volume to the direction of the price action can give an indication if it is a real broad market move or if it is a thin market move that may not be respected.
The Role of Timeframes in Chart Analysis
The time frame that you are using will determine what a chart shows. That the same commodity is bullish on a weekly chart and pullback on a daily chart is correct – both are answering different questions on a different time frame. Selecting the appropriate time period for an analytical question is a practical skill.
The way the main timeframes usually operate when analyzing commodities:
- Long-term monthly and weekly charts provide a better understanding of price cycles and structural levels, which is helpful for positioning the current price in multi-year time frames.
- The charts that are used the most for medium-term analysis are the daily charts, and the most important support and resistance zones are found on these charts.
- The 4-hour charts reveal inner trend structure: consolidation areas, pullback depths and transition points that cannot be seen on the daily chart.
- The hourly charts provide more detailed insights into sessions but at the price of more noise as compared to higher time frames.
- 30-minute charts can be used to see the intraday movement of price action near significant levels, particularly during active trading hours.
- Sub-30-minute timeframes have the lowest pattern consistency and are used mainly for intraday observation.
One of the popular professional methods is to take a look at a higher time frame first to get the directional context; then, one can proceed to a lower time frame to observe the details. This does not stop analytical mistakes, but it does help to minimize the chances of taking a short-term counter-trend swing for a significant structural move.
Common Errors in Commodity Chart Interpretation

Traders with a good technical base also commit common errors in interpretation. Knowing what they are is a good first step to developing more consistent habits over time.
There are predictable patterns to chart reading breakdowns:
- The more indicators that are added to a chart, the more confusing the signals that they give and the more difficult objective reading becomes.
- Patterns as facts – patterns in the chart are not facts – they are tendencies in past behavior.
- Setting aside the broader time frame context and taking action based on signals that are in full contradiction to the overall trend.
- Interpretation of volume-price relationships incorrectly in low-volume periods (e.g. prior to holidays), when volume-price relationships are weak.
- Using indicator parameters that are optimized for equity markets, without taking into consideration typical ranges of commodity markets.
- In a market such as natural gas or agriculture, where fundamentals play a major role, one single scheduled report can completely wash away any technical setup.
- Over-anchoring to past price levels in markets where significant changes have occurred in the supply or demand, in which past zones are no longer of any analytical value.
In a recent 2025 behavioral finance study, overconfidence in technical signals is identified as one of the most common psychological biases affecting retail investors, leading to excessive trading and, subsequently, sub-optimal performance right across markets, including commodity instruments. Knowing about that tendency doesn’t make it go away, but it’s a good beginning.
Keeping Chart Analysis in Proper Perspective
Commodity price charts are not a system on their own, but rather a part of a greater analysis toolbox. They are a reflection of fundamental, behavioral and structural market forces, and to read them well, you need to know what they’re telling you and what they’re not.
There are several observations that are constant in commodity chart analysis, irrespective of the commodity or method:
- Patterns and indicators are not guaranteed, but are indicative of probability
- In markets that are supply-sensitive, fundamental data can take precedence over technical setups.
- The skills to read charts develop with repeated and continuing exposure over time.
- No one indicator or chart form is consistently effective for all commodities and conditions.
The skill of reading a chart is a gradual process. Visual patterns begin to become more familiar, time frame indicator movement becomes more logical, and the interaction between time frames begins to add up. It’s not a timeless art – the market manifests differently, the levels of volatility can change, and what worked in one market cycle may not work in the next. Analyzing a chart is more of a continuous, evolving process rather than a set of rules to learn and then follow for the rest of one’s life.
Disclaimer
This article is meant for information and education only. It is not financial advice, investment advice, or a recommendation to buy, sell, or hold any commodity, financial instrument, or derivative product. Trading commodities, whether by futures or contracts for difference (CFDs), is risky and is not appropriate for everyone. CFDs are complex instruments and involve a high risk of a quick loss of money due to the use of leverage. Commodity prices can both go up and down and you can lose more than you invest. The performance of a security in the past is not a guarantee of future performance, and indicator patterns or chart formations are not always accurate. Please consult a qualified financial advisor for independent advice before investing or trading in any financial securities.