Excel Stock Chart
The stock chart in excel, also known as a high-low-close chart, represents the conditions of data in markets such as the stock market. The data reflects the changes in the prices of the stocks. Users can insert it from the “Insert” tab of the Excel application, and choose from the four types of stock chart options.
High-low-close is the most used as it has three series of high and low prices to exhibit the level of fluctuations affecting the stocks. Thus, the users can use up to six series of prices in stock charts. Such charts, however, can also be used to detect changes in weather conditions and other similar purposes.
How to Create Stock Chart In Excel? (Step-by-Step)
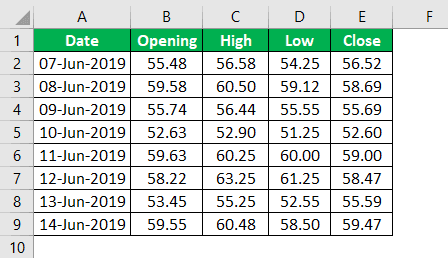
To create a stock chart in Excel, users or analysts need a correct set of data on stock prices daily. There needs to have an opening price, a high price during the day, a low price during the day, and what is a close price during the day. So, for demonstration purposes, below data of stock prices has been created:
You can download this Stock Chart Excel Template here
This topic highlights key concepts and provides a broader understanding of the field. If you’re curious to explore these ideas more thoroughly, this financial analyst course offers a structured way to do so.
How To Use Stock Chart In Excel?
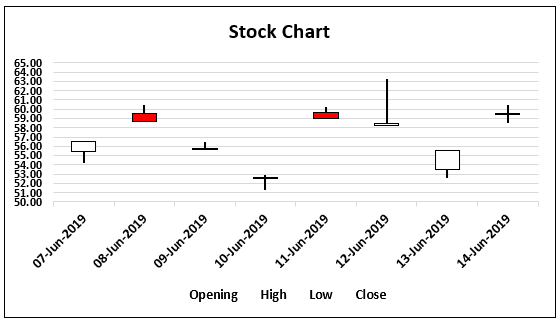
The above stock chart in Excel example clearly shows what the final presentation would look like. The next thing that users or analysts must know is how to use this chart to read and interpret the data properly. The first thing to look into is the opening price and the closing price.
Some boxes have filled colors, and some do not. One must rely on these boxes to identify which are open and which are close prices.
If it’s a non-filled box, the opening price is a downward arrow, i.e., the stock is profitable for the day.
If it’s a filled box, the upward arrow is the opening price, i.e., the stock is under loss for that day.
The continuous line of an upward arrow indicates the high price for the day, and the continuous line of a downward arrow indicates the low price for the day.
Using the stock chart, one can analyze the charts and make some interpretations. We have four stock charts available in Excel, below are the types.
“High – Low – Close,” “Open – High – Low – Close,” “Volume – High – Low – Close,” and “Volume – Open – High – Low – Close.”
Based on the structure of the data, users/analysts can choose the appropriate one to show the numbers in the graph.
This topic highlights key concepts and provides a broader understanding of the field. If you’re curious to explore these ideas more thoroughly, this online power query course offers a structured way to do so.
Follow the below steps to create your first Stock Chart.
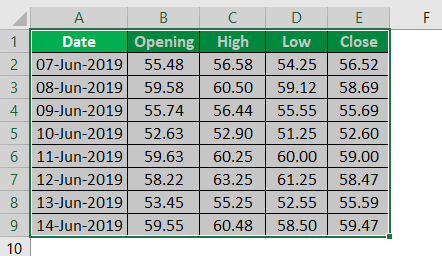
1. Select the data in the worksheet.
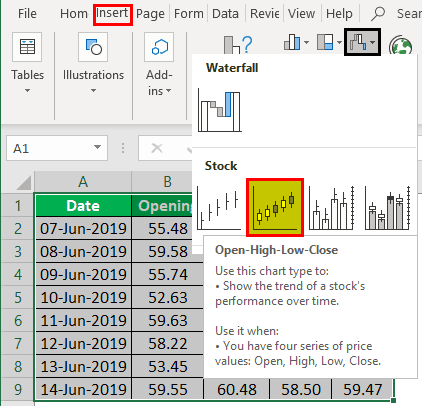
2. Go to INSERT> Stock Chart > Open-High-Low-Close.
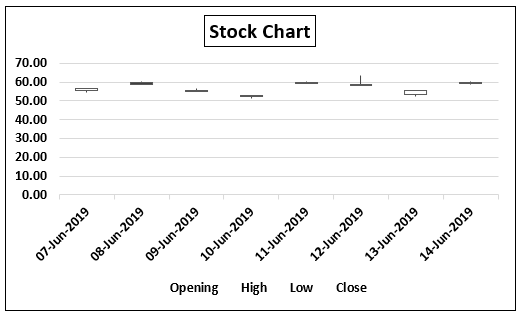
3. Now, we will have a chat like the one below.
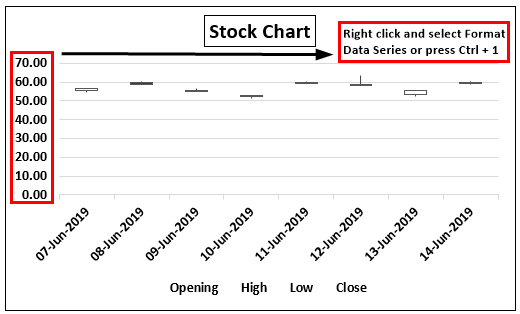
4. Select the vertical axis and press Ctrl + 1 keys.
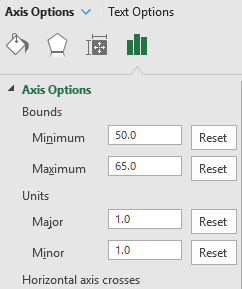
5. In the format data series box, make “Minimum” as 50 and “Maximum” 65, and “Major” 1.
6. Now, enlarge the chart vertically and horizontally. We will have a chart below.
In this chart, each date clearly appears. It gives us a box with upward and downward arrows. The upward and downward arrows represent the opening and closing stock prices for each date, but we do not know which is the opening and closing stock price. We cannot say which is opening and closing because there are situations where an opening is more and closing is less and vice-versa.
Recommended Articles
This article is a guide to what is Stock Chart in Excel. Here we explain how to create it step by step and use it with examples and downloadable templates. You can learn more about Excel functions from the following articles: –