Although support and resistance lines are very common tools to predict trends, they have different purposes. Let us look at their distinct points of difference:
Table Of Contents
What Is The Support Line?
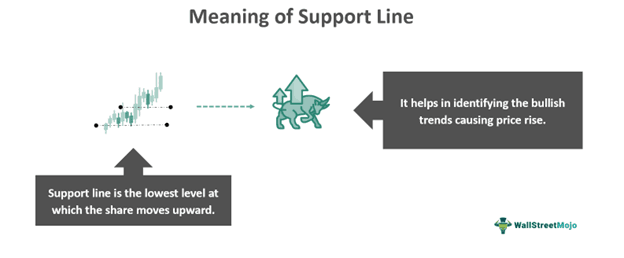
A Support Line is a point or level after which the price of a stock (or security) finds support on the chart. It is mostly used as a part of technical analysis. The sole purpose of this line is to detect a phase after which the price refrains from falling.
It is also referred to as support levels that help determine the future trends of stocks. It also helps traders to develop strategies for trading in the market. Likewise, they can also estimate the entry and exit points for buying or selling a security.
Key Takeaways
- Support line is a level at which the price cannot sustain to drop further. Instead, it takes support and creates a bullish trend.
- This event occurs due to increased demand among traders.
- On stock charts, traders can draw a horizontal line to represent support at price lows. However, it can also slant or tilt.
- With the use of Fibonacci tools, RSI, trendlines, and other indicators, it is possible to estimate support levels.
- It differs from the resistance level as it occurs in the lowest price ranges. However, the resistance line pushes the price into the bearish zone.
Support Line Explained
Support line is a stock market term used to describe the point after which the stock price does not fall. It acts as a support for the price to rise upward after a downward trend. Also, it provides a better forecast for further price trends. Traders find it feasible to identify potential buying opportunities. Thus, a stock having a support level at $20 means that the price will now witness an increased demand. As a result, the price tends to enter a bullish trend.
The implication of support lines in trading occurs as horizontal lines placed on candles. It draws a line on the lowest lows (wicks of the candlestick) which might act as a support for the price to rise. Likewise, this line can be either slanted or tilted upwards, indicating a futuristic demand. In that case, the traders and investors become bullish or optimistic about the stock and may tend to place buy orders. If that occurs, the market will try to match with the demand, which in turn raises the price for it. Thus, traders can use different technical indicators to determine the support line stock and book their profits. However, it is equally important to identify the entry-exit points for the same.
Certain strategies can help in observing support line indicators for a particular stock. Yet, it is vital to also look for support role reversals at the same time. It means, in most cases, the support level may break after a certain point. As a result, the trend that was in the bullish zone may reverse and turn bearish (or downward zone). This point is also referred to as the resistance line.
How To Trade?
Traders can use different technical indicators and trading strategies to identify the presence of these support line in trading. Some of them include Fibonacci tools, trendlines, Bollinger bands, RSI (relative strength index), and others. However, to have a practical outlook on it, let us look at the real-time plotting of a support level. Further, it will help in developing trading strategies.
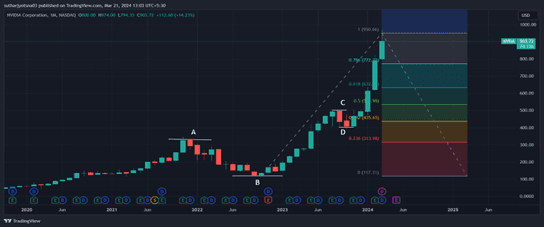
Following is the chart of Nvidia Corporation plotted on the TradingView platform’s interface. Let us look at them:
 Source: TradingView
In this chart, multiple candlesticks represent the bullish and bearish trends for the stock. However, two points represent support and resistance levels. Here, Point A is the resistance level at a price of $338.44, and Point B is the support level at a price of $119.36.
At the initial point, the price took resistance at Point A and went into a bearish trend, where the price fell by more than 200 points. It indicates that traders tend to sell more and book profits before it falls further. However, at Point B, the price reaches the lowest. It cannot withstand the massive selling happening in the market. Therefore, this point becomes a support line for the bullish trend to occur. After this point, we can see that the price of NVDA stock kept on rising until $950.66 on March 1, 2024. It allows traders to buy stocks and book their profits.
Within this period, the stock did witness a resistance level on Point C. The price of NVDA shares fell from $502.25 to $395.77 from September to October 2023. However, it again gained support at Point D to date.
Examples
Let us look at some examples of support line stocks to comprehend the concept better:
Example #1
Suppose Jevin Ltd has been listed on the stock exchange for the past five years. In this time frame, many traders and investors had bought their shares. Even the company financials have given positive results with good corporate ethics. However, Kevin feels the stock is within a bubble that might burst soon. In addition, the company was about to declare the last quarter results this month. As a result, he analyzed his peers and could sense negative sentiments for the industry.
On the announcement day, the company peers gave poor results, which further resulted in the initial selling of JVN stock. Kevin could see red candles now on the chart at a price of $350. At this point, the price had touched the height, but now, it resulted in massive selling. Out of FOMO (fear of missing out), the share price fell to $240. However, after competing with the poor results of peer companies, Jevin Ltd gained support, and the price stabilized in a bullish zone.
Example #2
According to a recent news update as of February 2024, the currency pair EUR/USD saw a channel break for the support created on the month's last date. The pair showed a negative trade that aimed to break the bullish trend and turn bearish. These low waves may reach a range of $1.0645 to $1.0820. However, the pair again took support on March 20, 2024.
Advantages And Disadvantages
There are certain pros and cons of support lines that traders must know while trading in the financial markets. Let us look at them:
| Advantages | Disadvantages |
|---|---|
| It helps in identifying futuristic trends for a stock. | There are no foolproof indicators for predicting trends. |
| They provide a floor for the traders to identify stock demand. | Different traders can place support levels at different time-frames which makes it inaccurate at moments. |
| Traders can estimate entry-exit points to determine the resistance level. | They are ineffective in highly volatile markets. |
| It is possible to use technical indicators and curate trading strategies with the support levels. |
For professional-grade stock and crypto charts, we recommend TradingView – one of the most trusted platforms among traders.
Disclosure: This article contains affiliate links. If you sign up through these links, we may earn a small commission at no extra cost to you.

Support Line vs Resistance Line
| Key Points | Support Line | Resistance Line |
|---|---|---|
| 1. Meaning | It refers to the price level that takes support to rise ahead. | The resistance line is the price floor that resists moving upward, instead pushing the price down. |
| 2. Estimation of trend | Here, the support created estimates a bullish trend. | This line predicts a bearish or downward trend followed by massive selling by investors. |
| 3. Demand | The demand is usually high leading to price rise. | Here, there is neutral or low demand, followed by a large supply in the market. |
Frequently Asked Questions (FAQs)
1
How do you draw a support line?
2
What is the best indicator for a support line?
3
