Table of Contents
What Is Volume Profile?
Volume profile is a technical indicator used in the financial market to depict the trading volume related to a particular price for a specific period. Traders often use this indicator in advanced charting platforms.
This indicator appears in the form of a histogram along with a price chart and shows the volume traded. It is used to identify buy and sell positions and offers valuable insight into support and resistance levels. It visually represents the price where most action takes place.
Key Takeaways
- Volume profile is a popular indicator used in technical analysis, which shows the trading volume for each price level.
- Traders use it to identify the support and resistance levels that help in deciding the buy and sell positions.
- It appears in the form of a histogram along with the price chart within the charting platform.
- It denotes the trading activity levels of the financial instrument at a particular price, which is essential to assess the market sentiments.
Volume Profile Explained
Volume profile is a popular technical indicator that traders use to estimate the trading volume related to a specific price over a certain period. It is visible within the chart in the form of a histogram, along with the price levels. However, the trader can select the settings based on individual preferences to get the required data.
This volume profile trading strategy is commonly used as a measure of market sentiments because it helps in assessing the volume of trading activity at individual price levels, which is valuable data for deciding the entry and exit points while trading. This tool is very useful to get confirmation regarding crucial trading levels.
The chart appears on the y-axis, and each bar of the histogram represents the volume of trade. The longer the bar, the more the volume. Short bars indicate less trading volume. The time range can be set by the trader using the setting preference within the chart to suit their financial objective.
In some charts, the bars depict the buy and sell volumes separately using different colors for better understanding, which depends on the type of software being used. The indicator acts as a guide to estimate the trading momentum, which is necessary to frame trading strategies and take advantage of market conditions to earn profits.
Types
The common types of the volume profile trading strategy are given below:
- Auto Anchored – It automatically determines the volume and price levels based on the timeframe of the current chart and finds the volume profile for them.
- Fixed range – It calculates volume for a definite period so that traders can analyze the buy and sell activity for range and not for the entire price movement for the financial instrument.
- Periodic Volume profile – This calculates a sequence that indicates the volume distribution across different price levels within a particular period.
- Session Volume Profile – This calculates the volume for a session or sub-session so that traders can study the intra-day activity for one part of the session.
- Session Volume Profile HD (SVP HD) – In addition to the Session volume profile, it adjusts the details as the trader zooms the chart. With fewer bars, more levels and details appear.
- Visible range (VRVP) – This calculates the volume profile within a particular price range. This is useful for traders who want information about the recent trends in the market.
How To Read?
The trading volume profile indicator is displayed in the form of a horizontal histogram, also called a bar chart, along the y-axis. Their length depicts the volume for every price level for a particular period. Therefore, longer bars have high volume, and shorter bars have low volume.
The time range depends on the trader’s preference. The default is the currently visible time on screen, but it is not very useful because the volume profile changes each time the trader zooms the screen in and out.
Some components of the volume profile indicator are:
- Point of control (PoC) – This is the price level with the highest volume and the main interest of the traders.
- Value area – It is the price range within which a percentage of the total traded volume occurred. The commonly used value is 70%, but it may change depending on the trader’s preference.
- Low volume node – This is the price level in the chart with low volume, indicating low buy and sell activity.
- High volume node – This is the price level with high volume, indicating a high level of activity.
To facilitate interpretation, the ars are sometimes displayed in different colors; usually, green is for buying volume, and red is for selling volume.
Strategies
Here are some common strategies that traders should use within the concept.
- Traders need to identify the volume shelves, which are concentrated trading activity and represent the supply and demand of the market. Long shelves indicate a balance between supply and demand. Shorter shelves indicate imbalance and low trading activity, creating gaps and giving rise to volatility in the future. The longer ones are also useful as support and resistance.
- Time frame analysis is equally crucial because it gives an overview of market trends and trading opportunities. Short-term charts will indicate trends that are suitable for shorter time frames, and long-term trends come from longer time frames. Comparison between different time frames helps eliminate false signals or invalid ones and decide the entry and exit levels.
- Time range analysis in volume profile indicator also provides good insight into the market. Visible range is the one that is currently seen on screen and helps understand support, resistance, and trends for the long term. The session range helps understand the price level of that trading session, which is relevant for intraday analysis. Traders may also customize the range as per their requirements.
- But it is advisable to use it in combination with other indicators, like moving averages, trend lines, oscillators, different candlestick patterns, and also fundamental analysis of financials and other data at the company, industry, and economic levels.
- The above strategies will give a comprehensive and accurate view of the market and act as a guide for the traders to recognize potential profitable trading opportunities.
How To Trade?
It is possible to understand the concept using charts from TradingView, as given below.
#1 - Support And Resistance
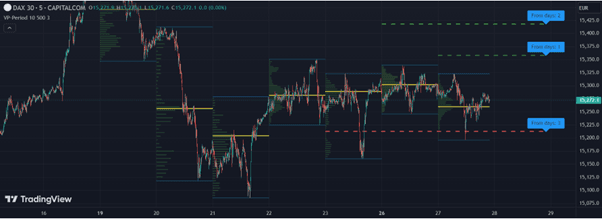
In the chart given below, the histograms in trading volume profile help in depicting the support and resistance lines in different colors. It is a daily chart where the support or resistance line appears based on the last block showing the volume profile. So if, in the last block, the Volume Point of Control (VPOC) line is closer to the price line that is lowest within the last block, then the support line appears, which will be below the VPOC line, maintaining a distance that is equal to the VPOC price and highest price in the last block. For the resistance line, the logic will be similar.
However, the lower the timeframe, the better it is for such calculations.
#2 - High Volume Nodes And Low Volume Nodes
This concept can also be detected using a chart from TradingView, as given below. In the chart below, the volume profiles appear as histograms that are depicted in different colors.
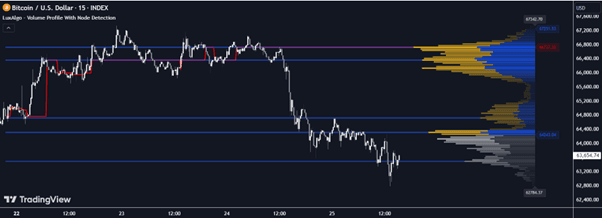
Here, node detection helps identify the volume at various price levels. The peak or highest volume node depicts the highest activity level, and the lowest node depicts the lowest activity level. They are shown using the yellow lines in the chart below.
In the chart below, the volume clusters show the consolidation zones. These are areas of indecision in spite of having good trading volumes.
Examples
It is possible to understand the concept of volume profile analysis better with the help of some suitable examples, as given below.
Example #1
On a trading day, John finds that the opening price of the stock is above the value area of the previous day, `but below Profile High, then John should wait and watch because there is every possibility for the price to go back to the Point of Control (PoC) again and then start rising. This is an ideal buying opportunity for the trader.
Example #2
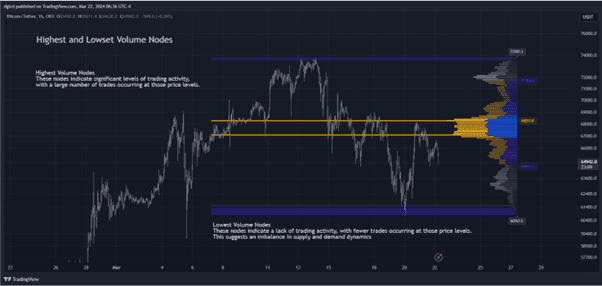
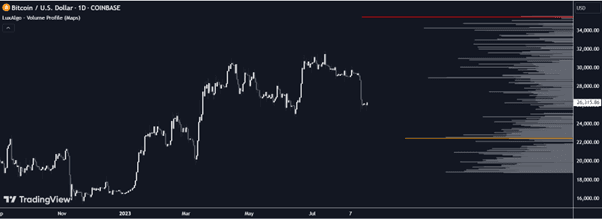
In the chart of volume profile analysis from TradingView, given below, the histograms on the right side show the volumes with respect to the price chart. The chart highlights the largest and second-largest prices in red and orange, making it easy to understand the concept. These may be used as support r resistance levels.
Advantages And Disadvantages
Here are some advantages and disadvantages of the concept.
Advantages
- Since it identifies the prices at which most trading is taking place, it helps in estimating a fair value of the financial instrument.
- It also indicates the direction or trend in the market. Good volume with a high price means buying pressure, and high volume at lower prices means selling is taking place.
- From the above point, it can be derived that it is also possible to get the momentum of the trend from this indicator.
- It is also helpful in indicating support and resistance. The high-volume nodes denote active trading with a greater possibility of breakout, and low-volume nodes are weak points, denoting low trading.
- It is also possible to detect imbalances in prices that can be exploited for gains.
- Being able to estimate the trading volume is suitable for not only identifying the entry and exit level but also the stop loss prices.
- Overall, it provides ideas for trading opportunities that can be exploited. It is compared and combined with other indicators to ensure a good trade is present, with a high probability of profit.
Disadvantages
- It takes a good level of skill and experience to master this indicator.
- Volume profile calculation requires more resources or data along with better software and systems.
- It increases cost because it requires data, which comes with subscriptions from real-time data providers.
- Data may be inaccurate or not updated, which leads to inaccurate results with gaps and errors.
- It isn't easy to backtest it since historical data is not always available.
- Coding the signals of volume profiles in the trading system is a complex process that requires a high level of programming skills.
Volume Profile Vs. Market Profile
Both the above are essential indicators of technical analysis used in the financial market. But there are some points of differences between them, which are as given below:
- For the former, the main aim is to understand the trading volume at a particular price, but the main aim of the latter is to identify the market behavior by combining time and price.
- The former gives a graphical representation of the distribution of volume over a specific price, but the latter shows graphically the time given to each price.
- For the former, there is a close relation between price and volume, whereas the latter creates a close relation between price and time.
- The former uses histogram for representation, whereas the latter uses letters for representation.
