Table of Contents
What Is A Zero Growth Model?
The Zero Growth Model simplifies stock valuation by dividing the annual dividend by the required rate of return. Although straightforward, it is impractical for companies to expect to grow and increase dividends over time. It is easy to understand, calculate and use this model.
For mature and stable companies with a history of consistent dividend payouts and minimal growth expectations, this model may provide a reasonable estimate of stock value. It can be applicable when a company's dividend policy aligns with a constant payout approach. It serves as a building block for more advanced valuation models, such as the constant growth model and multi-stage growth models.
Key Takeaways
- Zero Growth Model, sometimes called the Gordon Growth Model or Dividend Discount Model (DDM), is a financial technique that values a stock by valuing the company's dividends under the assumption that they will never increase.
- Even though it is straightforward, it serves as a foundation for more intricate models and is essential for valuing established, steady businesses that consistently generate dividends.
- It is used by investors as a first step in valuation, particularly when looking at assets with low growth prospects.
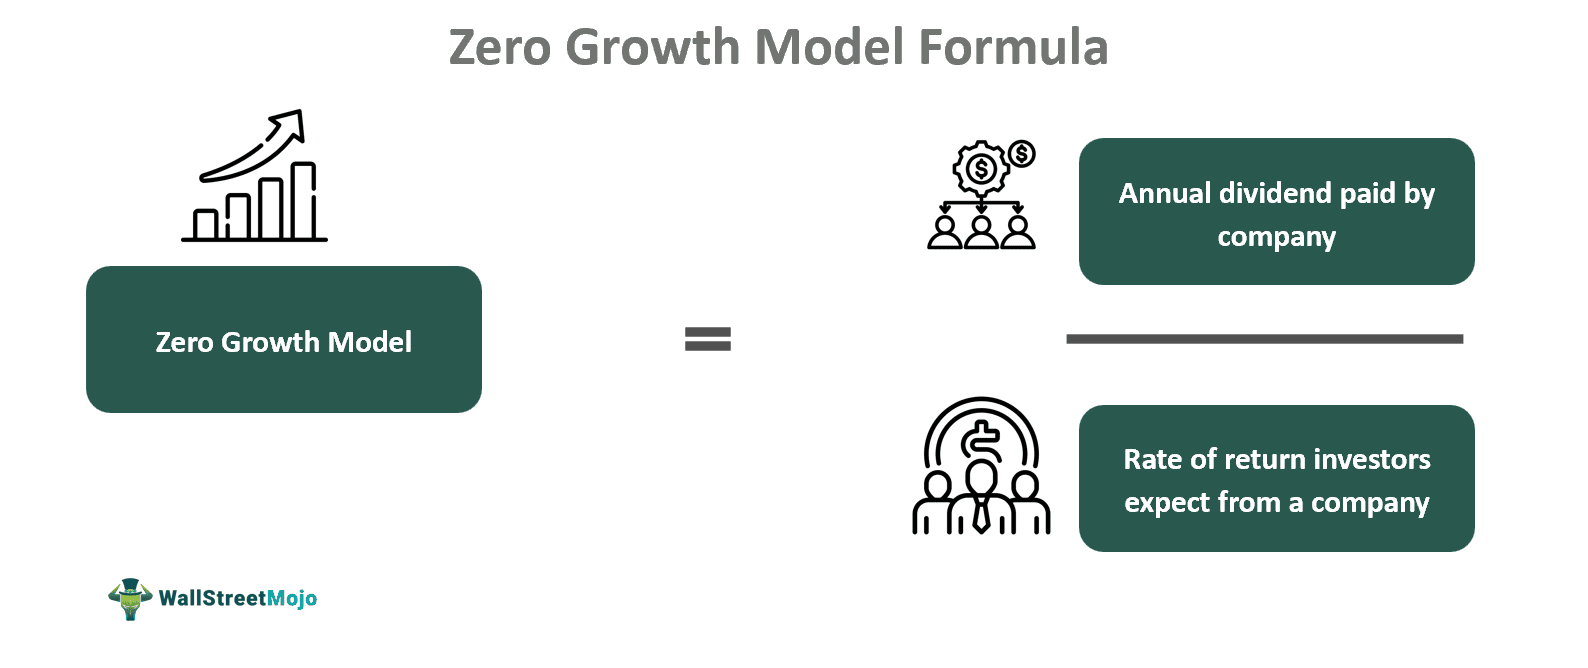
- P= (Dividend per share / Discount Rate) or (Div /r) represents the intrinsic value of a stock in the Zero Growth Model, which is calculated by dividing the yearly dividend per share by the needed rate of return.
Zero Growth Model Explained
The zero growth model is a basic method in finance used to assess a stock based on its anticipated future dividends. It is sometimes referred to as the Gordon Growth Model or Dividend Discount Model (DDM). This model represents a situation in which a corporation does not see an increase in earnings or dividends by assuming that dividends will stay constant forever.
The best candidates for this approach are steady businesses that are anticipated to continue paying out dividends steadily without experiencing rapid expansion. The zero growth model is a helpful starting tool for comprehending the connection between dividends, necessary rate of return, and stock value because of its simplicity. Its shortcomings, however, become evident when working with businesses that are expected to expand and raise their dividends over time, for which more complex valuation models are often employed.
The act addressed flaws in the trustee system, where bondholders could take action but often faced challenges in rallying support from other bondholders due to their scattered locations. Trustees are now required to maintain a list of investors to facilitate communication among them.
Moreover, the act grants investors more substantial rights, such as the ability for bondholders to independently pursue legal action to ensure they receive their rightful payments.
How To Calculate?
The zero growth dividend discount model has a straightforward method for figuring out a stock's value. An explanation of the parts and how to apply the formula is provided below:
Stock value (P) = Dividend per share / Discount Rate, or Dividend / r
The value of the stock (P) that we are attempting to estimate is its current value.
Dividend per Share: The amount that the company pays out as a yearly dividend for each share of its stock. It is basically the total cash that an investor is likely to get over the year for each share.
Discount Rate (r): An investor's expected rate of return on investment is the discount rate, sometimes referred to as the required rate of return. In comparison to other investments with comparable risk profiles, it shows the opportunity cost of purchasing the stock. Both the intrinsic risk of the investment and the temporal value of money are taken into consideration by the discount rate.
Using the investor's needed rate of return as a base, this formula effectively determines the present value of future cash flows, or dividends. Assuming a constant payout over time, it represents the case of dividend growth of zero.
Examples
Let us look at some examples to understand the concept better:
Example #1
Now, let's assume that Investors have a required rate of return of 5% and that Company XYZ pays an annual dividend of $2 per share. By applying the zero growth model formula, we are in a position to get the stock value:
P = Dividend per share / Rate of Discount or Dividend / Rate
$2 / 0.05 = $40
Thus, in this case, the stock of Company XYZ would be worth $40 a share based on the zero growth model. This is presuming that investors want a 5% return on their investment and that the company would always pay a dividend of $2 per share.
Example #2
Think about a business called XYZ that has a perpetual dividend growth rate of 6% annually. Just now, this year, the business distributed a $8 dividend each share. Investors must receive a 12% annual rate of return.
The following are the parameters:
Dividend at zero year (Div) = $8; required rate of return (r) = 12%; and constant growth rate of dividends (g) = 6%
Div* (1 + g) = $8 * (1 + 0.06) = $8.48 is the expected dividend per share at the conclusion of the first year or Div1.
The share's value (P) should now be determined.
Dividend per share (P) = Div1/(r-g) = 8.48 / (0.1 2-0.06) = 8.48/0.06 = $141.33
That means investors should think about buying the stock for less than $141.33 if they want to meet the needed 12% annual rate of return.
