


After the Fed meeting and the release of the latest US inflation and GDP data, the dollar weakened. The US Dollar Index lost 1.6% and fell below 100.
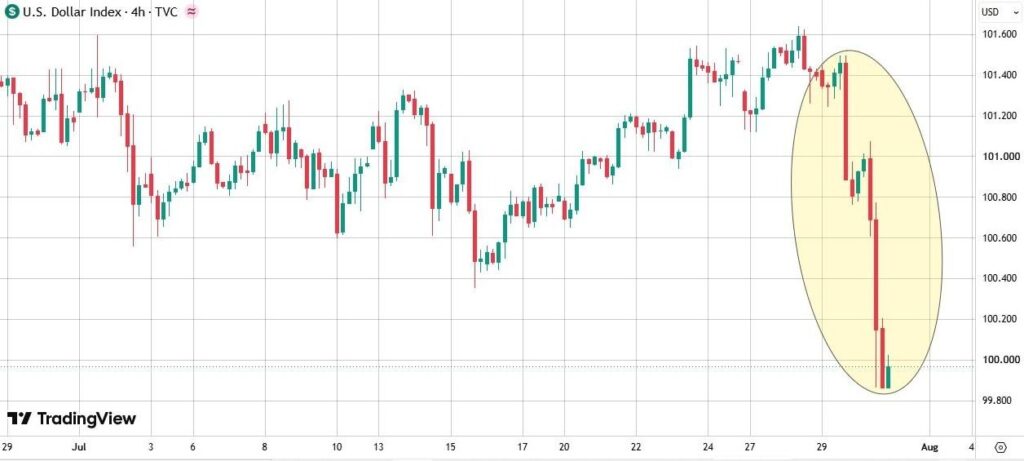
The reaction in the bond market was far less straightforward. The yield on the 30-year Treasury climbed to 5.2444%, reaching its highest level since 2007. This happened even though the Fed kept rates unchanged and the June inflation figures were relatively benign. Evidently, the bond market is pricing long-term risks very differently.
To understand why an inflation report that initially appeared encouraging failed to reassure bond investors, it is worth taking a closer look at the details.
The monthly inflation data for June showed a clear cooling. According to the Bureau of Economic Analysis, the PCE index declined by 0.1% from May, while its annual rate slowed from 4.1% to 3.7%. Core PCE, which excludes food and energy and is considered a more stable measure of inflationary pressure, rose by only 0.1% month over month and 3.3% year over year.
So where is the problem? It becomes apparent once we look beyond the monthly data and examine the second quarter as a whole. During the second quarter:
- the PCE price index rose at an annualized rate of 5.1%;
- the gross domestic purchases price index increased by 5.7%;
- core PCE increased at an annualized rate of 3.4%.
Monthly changes compare one month with the previous one and are not annualized. Quarterly figures work differently: they compare the average level in the second quarter with the average in the first one and then express that change as an annualized rate.
June tells us that inflation cooled toward the end of the quarter, but it does not erase the increases recorded in April and May. There is another point as well. The quarterly figures show that a large part of the current inflationary pressure is coming from volatile components, especially energy. It is a sign that the disruption in the Gulf and the crude oil market is beginning to leave scars on the economy.
The GDP report was not particularly encouraging either. US real GDP grew at an annualized rate of just 1.5% in the second quarter, down from 2.1% in the first.
This helps explain the divergence between the DXY and long-term Treasury yields. The two respond to different parts of the economic outlook.
The dollar tends to respond mainly to expectations for near-term monetary policy, as well as to the gap between short-term interest rates in the United States and those in other major economies. The benign June inflation data and the Fed’s decision to leave rates unchanged therefore softened the near-term policy outlook and pushed the dollar lower.
The 30-year Treasury yield reflects something different: long-term inflation expectations, economic uncertainty, and the premium investors demand for tying up their capital for many years.
The next releases will be crucial in determining whether the dollar’s decline can continue. According to the US economic calendar, the first — the July labour market report — is scheduled for August 7, followed by the CPI data on August 12.
On August 26, the second estimate of second-quarter GDP and the July PCE data will be released on the same day. Both reports will be especially important ahead of the September 15–16 FOMC meeting. For now, markets are pricing in an almost certain 25-basis-point rate hike.