What Is Asset Coverage Ratio?
Asset Coverage Ratio is a risk analysis multiple which tells us about the company’s ability to repay the debt by selling off the assets and provides details of how much of the monetary and tangible assets are there against the debt.
It helps an investor to predict future earnings and gauge the risk involved in the investment. Generally, a minimum ratio is already defined by the authorities for the companies to maintain a specific level of debt to balance the company’s leverage position. The higher the ratio, the higher is the investment favorability since the high ratio denotes that the assets of the company outweigh the liabilities and the company is financially stable with effective capital management.
Asset Coverage Ratio Explained
Asset Coverage ratio helps investors identify the capacity of the company to repay its long-term financial obligations. A high ratio signifies financial stability. In addition, it helps in evaluating the company’s solvency and risk absorption capacity.
This ratio can be used to company the entity with its peers in the industry. The numerator of the ratio considers only the tangible assets and current liabilities, which are divided by total debt to get the value.
If used efficiently, the asset coverage ratio for banks or any other entity can prove to be an excellent resource for analysts; certain other factors also need to be considered along with this ratio to make an informed decision. It is helpful for both the investors, equity, or debt, and comparing the ratio with a competitor and industry standard can give a clear picture of the financial health of any company.
Formula
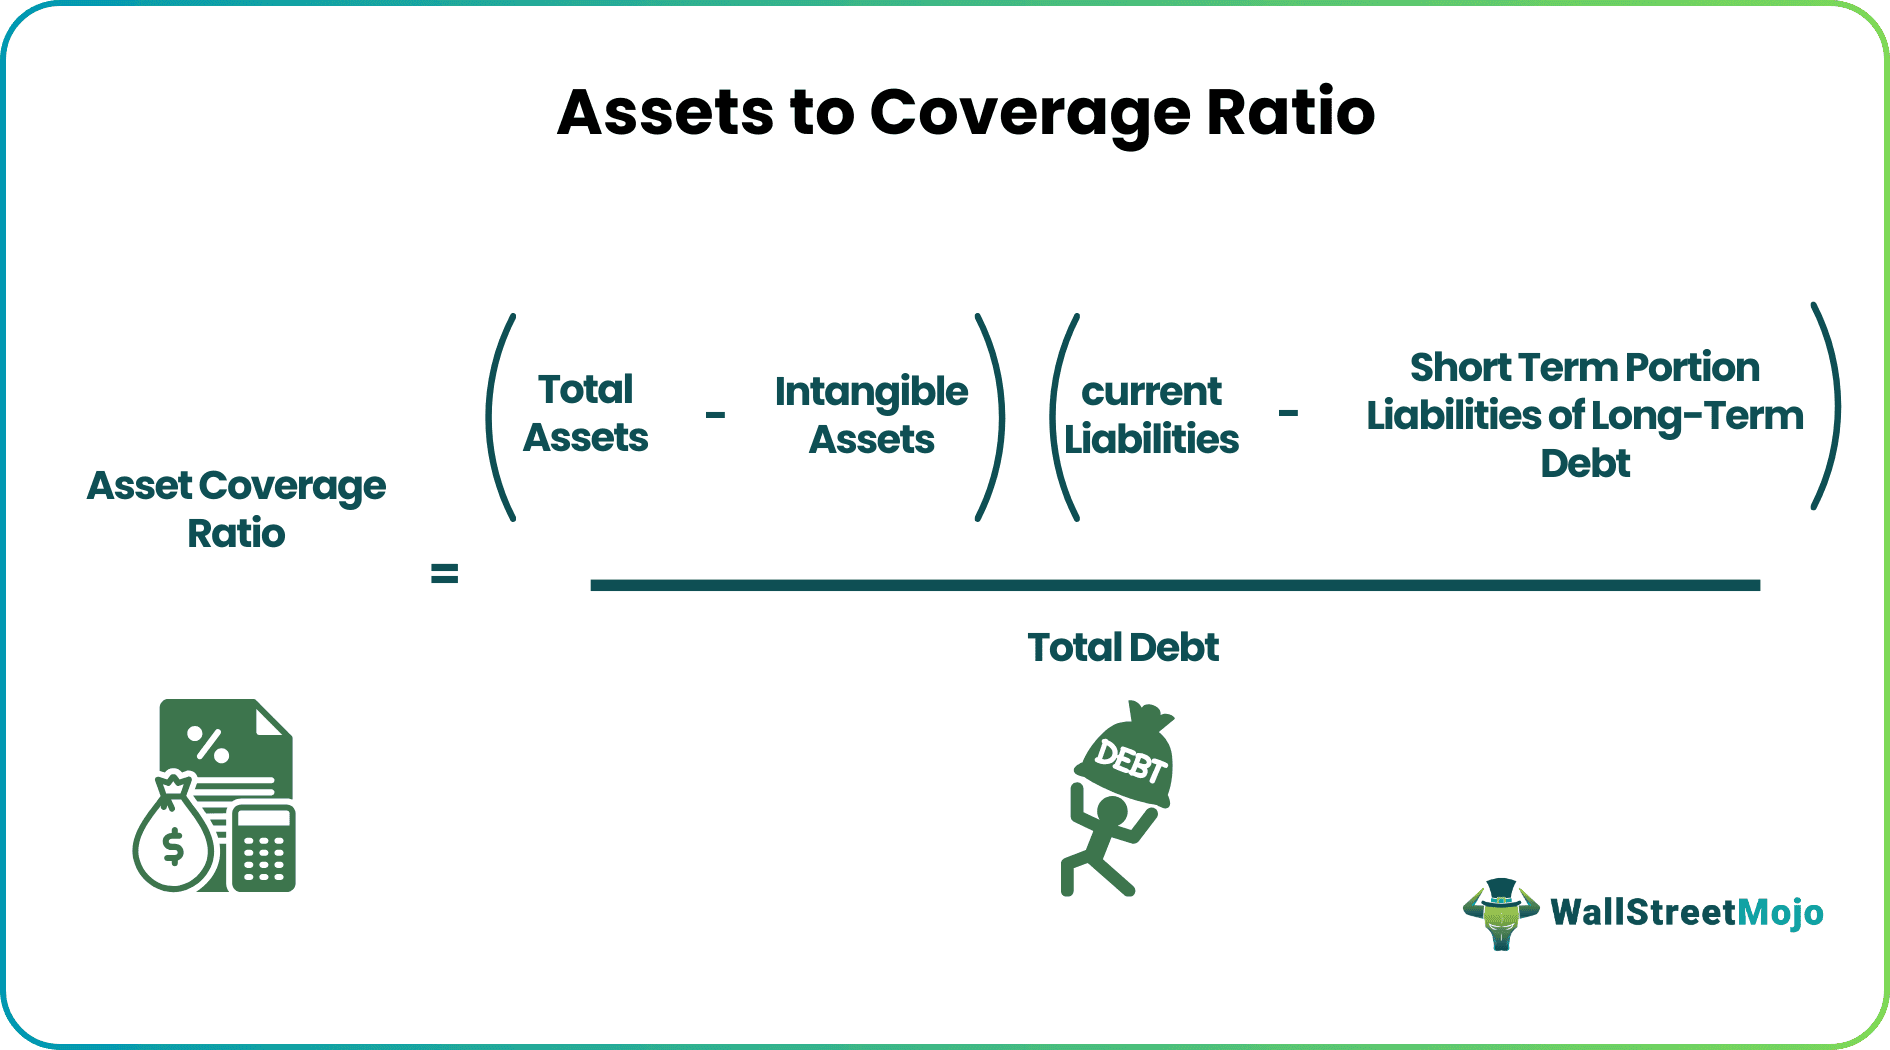
Let us look at the asset coverage ratio formula to understand the concept.
Asset Coverage Ratio = (Total Assets – Intangible Assets) – (Current Liabilities – Short term portion of long-term debt) / Total Debt
Examples
Let us understand the ratio with two examples; in the first one, we will calculate the ratio of an individual company, and in the second example, we will try to understand how to calculate asset coverage ratio and evaluate the ratio of 2 companies from the same industry.
Example #1
Let us assume that below is the data for Netflix for the year 2017-2019; now, let us see how to calculate asset coverage ratio for them.
Solution

- =((200-80)-(40-30))/150
- =0.73
Asset Coverage Ratio for the year 2017, 2018, 2019 is as follows –

From the above example, we can see that the ratio for Netflix has improved from 2017 to 2019; we will interpret and discuss this ratio in the next section.
Example #2
Let us compare two telecom giants in the USA, T-Mobile, and Verizon, whose Asset coverage ratio we calculate using the asset coverage ratio formula.
| Company | 2017 | 2018 | 2019 |
|---|---|---|---|
| T-Mobile | 1.3 | 0.9 | 1.1 |
| Verizon | 1.2 | 1.3 | 1.35 |
Interpretation And Analysis
The higher ratio tells us that the company has enough assets to repay its debt and the lower ratio signifies that the liabilities outweigh the assets and risk factors are involved.
Example 1:
We can see that Netflix’s Asset coverage ratio decreases from 0.73 in 2017 to 0.64 in 2018, but then increases drastically from 2019 to 1.35. So, Netflix initially in 2017 has assets to cover only 0.73 portions of its liability, whereas, in 2018, it went down further, which means the company is either taking more debt or is selling off its assets, which makes the ratio go down. In 2019, the ratio shoots up to 1.35, which says either that the company has repaid a portion of its long-term debt of the company is expanding with effective production management by investing in more Fixed Assets.
Example 2:
The fixed asset coverage ratio for T-Mobile and Verizon for the years 2017, 2018, and 2019 are 1.2, 1.3, and 1.35. We can see that there is a lot of movement in T-Mobile from 1.3 to 0.9 and finally to 1.1. Whereas, comparatively, Verizon comes across as a stable company maintaining the ratio year on year. It doesn’t necessarily mean that Verizon is a better investment avenue than T-Mobile; numerous other factors need to be considered before making the final decision. For example, it might be a possibility that T-Mobile is planning to launch a range of new services in the market, and for that, it is increasing the debt on its balance sheet.
On the other hand, Verizon is playing safe by maintaining the standard ratio without any new launch; a short tern dent might be to gain long term benefits. This ratio just tells us the debt and assets balance of any company at a particular time period; then, it is the analyst’s job to consider other factors before making the final call.
Advantages
- The asset coverage ratio for banks or any other entity can act as an indicator for the company to make future decisions about investment and expansion; if the ratio is getting lower year on year, then the company might see this as the right time for investment as it will boost this ratio.
- Also, this ratio can be best utilized if it is combined with effective management decisions, which can be found in the annual filing report or quarterly meetings.
Disadvantages
- One of the major disadvantages of this ratio is that it uses Balance sheet figures and that too at Book value and not the liquidating or market price.
- Also, an analyst should not concentrate only on the fixed asset coverage ratio to decide. They should also consider plenty of other financial ratios to get a clear picture of the company.
Recommended Articles
This article has been a guide to what is Asset Coverage Ratio. We explain its formula with example, interpretation and analysis, advantages & disadvantages. You can learn more about financing from the following articles –