Part of our Statistical Concepts guide
What Is Extrapolation Formula?
The extrapolation formula refers to the equation used to estimate the value of the dependent variable concerning an independent variable that shall lie in a range outside of the given data set. The expression helps figure out unknown valued based on the values that are already known.
It is certainly known for the calculation of linear exploration using two endpoints (x1, y1) and the (x2, y2) in the linear graph when the value of the point extrapolated is “x,” a formula that one can use is represented as y1+ *(y2−y1).
Key Takeaways
- The extrapolation formula is utilized to estimate the value of a dependent variable for an independent variable beyond the range of available data.
- This technique is commonly employed for forecasting data that falls outside the existing range of observations.
- Extrapolation assumes that the observed trend will continue beyond the known data range, which is not always guaranteed.
- It is important to exercise caution when using extrapolation and consider potential uncertainties or deviations from the assumed trend.
Extrapolation Formula Explained
Extrapolation formula is the expression that is so derived that it lets users extend the existing or known values and use them to calculate the new value. As the name suggests, the available data are extended extra to derive new unknown values.
It is different from interpolation, which helps derive an unknown value based on the known related values. Considering the related known values makes interpolation a more efficient method of finding unknown values, but then extrapolation helps users know the range to which the values may extend.
How To Calculate?
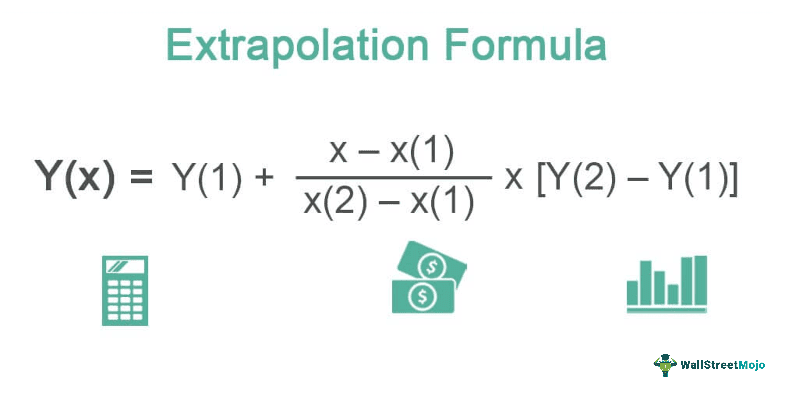
The expression that helps calculate extrapolation is as follows:
Y(x) = Y(1)+ (x- x(1)/x(2)-x(1)) * (Y(2) – Y(1))
The formula for linear extrapolation can be divided into the following steps:
- First, one must analyze the data to determine whether the data is following the trend and whether one can forecast the same.
- There should be two variables: one has to be a dependent variable, and the second has to be an independent variable.
- The numerator of the formula starts with the previous value of a dependent variable. Then one needs to add the fraction of the independent variable while calculating for mean for class intervals.
- Finally, multiply the value arrived in step 3 by a difference of immediately given dependent values. Adding step 4 to the dependent variable’s value will yield the extrapolated value.
Examples
Let us consider the following examples to understand the concept better and also check the calculation part of it:
Example #1
Suppose that the value of certain variables is given below in the form of (X, Y):
- (4, 5)
- (5, 6)
Based on the above information, you must find the value of Y(6) using the extrapolation method.
Solution
Use the below-given data for calculation.
- X1: 4.00
- Y2: 6.00
- Y1: 5.00
- X2: 5.00
The calculation of Y(6) using the extrapolation formula is as follows,
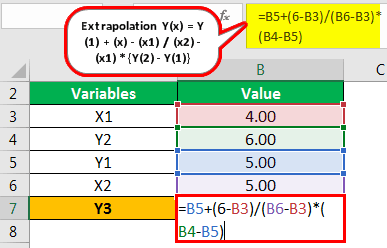
Extrapolation Y(x) = Y(1) + (x) – (x1) / (x2) – (x1) x {Y(2) – Y(1)}
Y(6) = 5 + 6 – 4 / 5 – 4 x (6 – 5)
The answer will be –
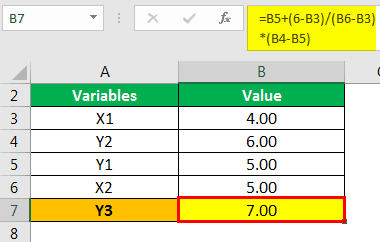
- Y3 = 7
Hence, the value for Y when the value of X is 6 will be 7.
Example #2
Mr. M and Mr. N are students of the 5th standard, and they are currently analyzing the data given to them by their math teacher. The teacher has asked them to compute the weight of students whose height will be 5.90 and informed them that the below data set follows linear extrapolation.
| X | Height | Y | Weight |
|---|---|---|---|
| X1 | 5.00 | Y1 | 50 |
| X2 | 5.10 | Y2 | 52 |
| X3 | 5.20 | Y3 | 53 |
| X4 | 5.30 | Y4 | 55 |
| X5 | 5.40 | Y5 | 56 |
| X6 | 5.50 | Y6 | 57 |
| X7 | 5.60 | Y7 | 58 |
| X8 | 5.70 | Y8 | 59 |
| X9 | 5.80 | Y9 | 62 |
Assuming that this data follows a linear series, you must calculate the weight, which would be the dependent variable Y in this example when the independent variable x (height) is 5.90.
Solution
In this example, we now need to find out the value, or in other words, we need to forecast the value of students whose height is 5.90 based on the trend given in the example. Then, we can use the below extrapolation formula in Excel to calculate the weight, which is a dependent variable for a given height and an independent variable.
The calculation of Y(5.90) is as follows,
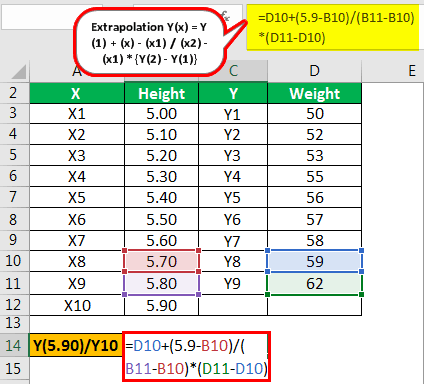
- Extrapolation Y(5.90) = Y(8) + (x) – (x8) /(x9) – (x8) x
- Y(5.90) = 59 + 5.90 – 5.70 / 5.80 – 5.70 x (62 – 59)
The answer will be –
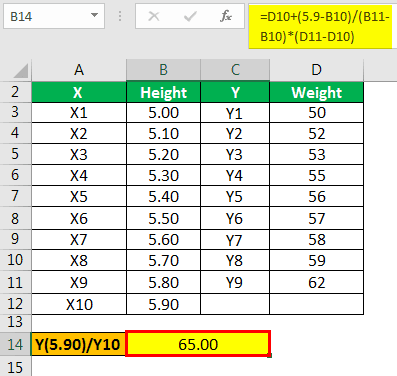
- = 65
Hence, the value for Y when the value of X is 5.90 will be 65.
Example #3
Mr. W is the executive director of the company ABC. He was concerned with the company’s sales following a downward trend. Therefore, he has asked his research department to produce a new product that shall follow increasing demand as and when the production increases. After 2 years, they developed a product that faced increasing demand.
Below are the details of the last few months:
| X (Production) | Produced (Units) | Y (Demand) | Demanded (Units) |
|---|---|---|---|
| X1 | 10.0 | Y1 | 20.00 |
| X2 | 20.00 | Y2 | 30.00 |
| X3 | 30.00 | Y3 | 40.00 |
| X4 | 40.00 | Y4 | 50.00 |
| X5 | 50.00 | Y5 | 60.00 |
| X6 | 60.00 | Y6 | 70.00 |
| X7 | 70.00 | Y7 | 80.00 |
| X8 | 80.00 | Y8 | 90.00 |
| X9 | 90.00 | Y9 | 100.00 |
They observed that since this was a new and cheap product initially, this would follow linear demand until a certain point.
Hence moving forward, they would first forecast the demand and then compare them with actual and produce accordingly as this has demanded huge costs for them.
The marketing manager wants to know what one would demand if they produced 100 units. Based on the above information, you must calculate the demand in units when they produce 100 units.
Solution
We can use the below formula to calculate the demands in units, which is the dependent variable for given units produced, which is an independent variable.
The calculation of Y(100) is as follows,
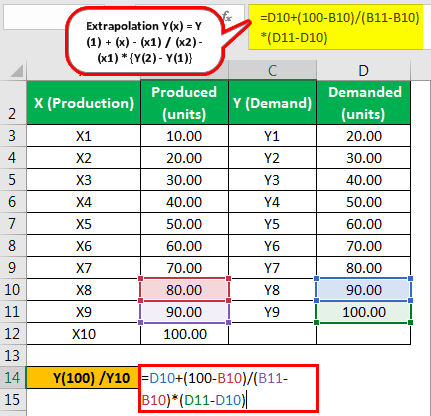
- Extrapolation Y(100) = Y(8) + (x)- (x8) / (x9) – (x8) x
- Y(100) = 90 + 100 – 80 / 90 – 80 x (100 – 90)
The answer will be –
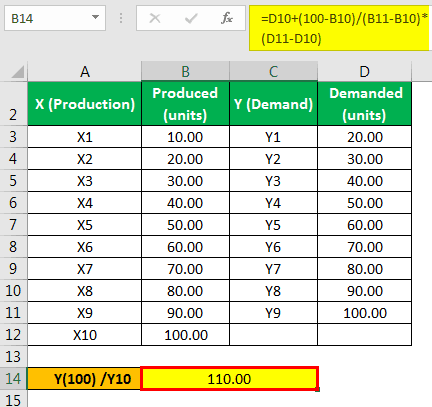
- = 110
Hence, the value for Y when the value of X is 100 will be 110.
Relevance and Uses
The extrapolation formula helps calculate unknown values and figures by extending the available values. The figure or value the formula helps derive becomes an important element for the firms.
Let us check out the importance of this formula below:
- It used to forecast data that is out of the current range of data.
- one assumes that the trend shall continue for given data and even outside that range, which is not always the case.
Hence, one should use extrapolation cautiously.
Frequently Asked Questions (FAQs)
What are the benefits of applying the extrapolation formula?
Benefits of applying the extrapolation formula include the ability to make predictions and estimates for values beyond the existing data range, providing valuable insights and guidance for decision-making processes. It can be particularly helpful in forecasting future trends and planning strategies for various scenarios, enabling proactive decision-making.
What are the assumptions followed by the extrapolation formula?
Assumptions followed by the extrapolation formula include the assumption that the observed trends or relationships will continue beyond the known data range, assuming stability in the underlying factors and a consistent relationship between variables. These assumptions serve as the foundation for projecting future values.
What are the limitations of the extrapolation formula?
Limitations include the introduction of uncertainty and potential errors, reliance on assumptions, potential inaccuracies due to unforeseen events or outliers, and reduced reliability as the extrapolated range extends further from the known data.
Recommended Articles
This article has been a guide to what is the Extrapolation Formula. Here, we explain the concept with examples, how to calculate it, and its relevance and uses. You can learn more about Economics from the following articles:-