Table of Contents
What Is Gartley Pattern?
Gartley pattern is a technical indicator that traders use in charting platforms to identify highs, lows, breakouts, and retracements. This Harmonic chart pattern uses Fibonacci numbers for the process.
H.M. Gartley established this chart pattern in 1935, and it is commonly used in the financial market. However, it is not a standalone indicator and should be used in conjunction with other technical indicators to get proper confirmation.
Key Takeaways
- Gartley pattern is an indicator used in technical analysis based on Fibonacci numbers.
- It is a harmonic chart pattern and is a scientific and statistical process to evaluate and analyze the price patterns in the financial market.
- It helps traders identify the entry and exit points and also change in trend or reversals to take advantage of bullish and bearish price movement.
- It is a 5-point structure, which H.M. Gartley put together in 1935, and since then, it has gained good popularity in the financial market.
Gartley Pattern Explained
Gartley pattern is a harmonic pattern that traders use in charting platforms to identify trend reversals, buy and sell points, and retracements so as to make informed trading decisions.
In 1935, H.M. Gartley invented this method, which is equally valuable for various timeframes. It offers an excellent potential to understand any possible continuation or trend reversal in the near future.
In this process of bearish or bullish Gartley pattern, there are four consecutive price movements, which typically suggest a continuation of the existing trend. The pattern has points ABCD and an extra leg. But before point A, a significant high or low move happens, which is also called point X. From X to A, it is the prevailing trend.
The Gartley pattern trading can be bullish or bearish, and that is decided based on which direction the price is moving after it has taken off from point X to A. Therefore, this statistical process helps traders decide when and what to buy, and it is equally applicable in markets involving the buying and selling of different financial instruments.
How To Identify?
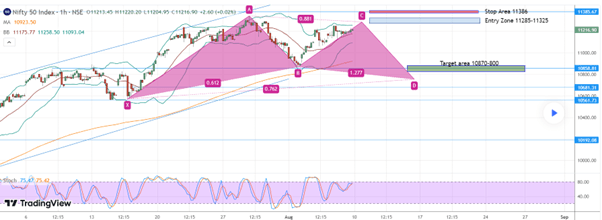
The concept is easy to understand using a chart from TradingView. In the hourly Nifty chart given below, the Gartley pattern is clearly visible. It shows a bullish pattern where the market first rises to point A from point X and then, after a short downtrend, again continues upwards from B to C. At point D, the entire pattern is complete, and the chart generates a buy signal, from which the upside price targets the buy trade.
Based on the Fibonacci ratio, the retracement of the bullish Gartley pattern from point A to B will be 61.8%, and from point B to point C, the retracement is 38.2%. At point D, the pattern completes, and from that level, the price target will be either C or A and 161.8 % from point A. The trader will use point X as the stop-loss level to reduce or control risk or loss. This method may not always be very accurate, but it is quite reliable up to a large extent.
The chart below shows a bullish pattern. But in case of a bearish pattern, the picture will be just the opposite, where the final ending point of D will be up, and it will take a downtrend in the future.
How To Trade?
Traders can successfully use this Gartley pattern indicator to trade with any financial instrument. The formation of this pattern indicates that the original trend from point X will resume again, be it upwards or downwards. Once the point of D is reached, the market will reverse and resume the old trend, which is an end to the retracement.
Ideally, the trader will also try to find a symmetry between the time of change of trend. The time taken for the price to change from X to A will be approximately the same as the time taken to change from point A to D.
In a bullish market, the trader may enter the market or take a long position at point D, and if it is a bearish market, it will be a short position or a sell decision at point D.
Examples
The concept of the Gartley pattern indicator is explained with the help of some examples, as given below.
Example #1
A trader, Jack, wants to enter the market by going long on the stock of ABC Inc. but needs clarification about the entry point. He checks with the Gartley pattern indicator to find that the stock will shortly be in an uptrend because the pattern is approaching point D, and it takes almost the same time for the pattern to complete from point A to D as it takes from X to A. However, he also compares the Fibonacci levels and cross-checks with other oscillators like RSI, and the same outcome is found. He enters the market at point D, after which the stock moves up.
Example #2
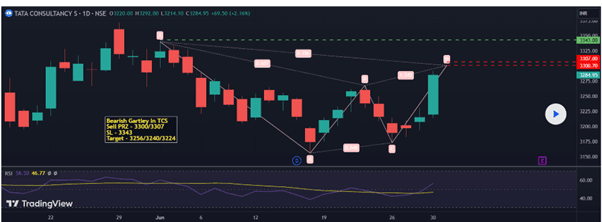
The daily chart of TCS given below shows the bearish Gartley pattern. Starting at point X and moving on to point A, the pattern has made the shape of the letter “W” and is finally at point D, from where the price movement is expected to be downwards. The trader should either sell off the stock at that level or short it to earn profits from the down move.
Pros And Cons
It is necessary to understand the pros and cons of the Gartley pattern trading as given below.
Pros
- This kind of pattern provides the trader with information about which way the market will move and at what time, along with the momentum or strength of the trend.
- It is helpful in predicting long-term price movements, and investors who wish to take long-term trades or make investments can use this concept for price clarity.
- The price targets at breakouts or breakdowns are helpful in deciding the profit levels in advance.
- It provides support and resistance levels due to the usage of the Fibonacci pattern in the calculation.
- It offers a high reward-to-risk ratio, thereby proving to be an excellent profit-earning concept if appropriately used.
- It is suitable for any timeframe and market to identify opportunities.
Cons
- It may be a complex process for inexperienced traders to identify the pattern in the chart and use it efficiently for trading.
- Gartley pattern target is not a standalone indicator, and the trader has to combine it with other technical indicators for better results.
- It can sometimes be subjective and not provide accurate results.
- While practically applying the concept, the indicator may deviate from the theoretical concept, which may be confusing.
- Traders who wish to follow the trend may find this process suitable. However, traders who want to use the counter-trend process may not use it.
Bullish Vs. Bearish Gartley Pattern
The above are the two types of Gartley patterns that are widely used in the financial market. But there are some differences between them as follows:
- The former shows that the market can go up, and the latter shows that the market can go down.
- The pattern in the charts takes the shape of the letter “M” in the case of the former, and the pattern takes the shape of the letter “W” in the case of the latter.
- In the case of the Gartley pattern target, from the end point D, the market will reverse and go up, whereas, for the latter, the market will reverse and go down from point D.
- At point D, the trader will take a long position to take advantage of the uptrend in the case of the former, and the trader will take a short position or sell off the financial instrument in the case of the latter.
