Part of our Chart Patterns in Technical Analysis guide
What Is Morning Star Pattern?
The morning star pattern is the candlestick pattern on a price chart with three candlestick formations. The pattern is an indicator associated with trend reversals and an upcoming price reduction for the referred stock or security and helps identify buying opportunities.
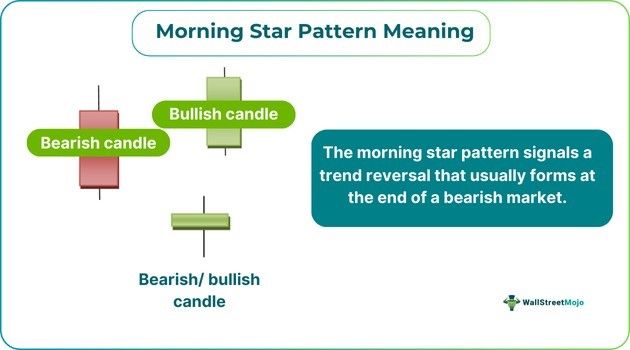
It is the opposite of an evening star pattern, where an uptrend signals a reversal. The morning star pattern signals a trend reversal that usually forms at the end of a bearish market, often after a long downtrend. It is observed over three days and appears at the bottom end of the downtrend.
Many traders use Saxo Bank International to research and invest in stocks across different markets. Its features like SAXO Stocks offer access to a wide range of global equities for investors.
Key Takeaways
- The morning star pattern is a bar pattern where the “star” candle is a small-bodied candle that often opens at the closing of the previous candle or opens a gap below it.
- The pattern signals a trend reversal that usually forms at the end of a bearish market, often after a long downtrend.
- Candlestick patterns help traders and investors analyze market movements and place trades. It comprises of three candlestick formations.
- RSI indicator and Bollinger Band can be used to analyze the pattern.
Morning Star Pattern Explained
The morning star pattern is a bar pattern where the star candle is a small-bodied candle that often opens at the closing of the previous candle or opens a gap below it. The pattern signals that the trend is changing from bearish to bullish. The morning star serves as a buy signal because it represents the bottom of the previous bearish run. These are the three candles:
- An extended bearish candle
- A small-bodied, bullish, bearish, or doji candle that opens at the previous candle’s close.
- A white bullish candle that begins at or above the preceding candle’s high point and closes at or above the first candle’s center.
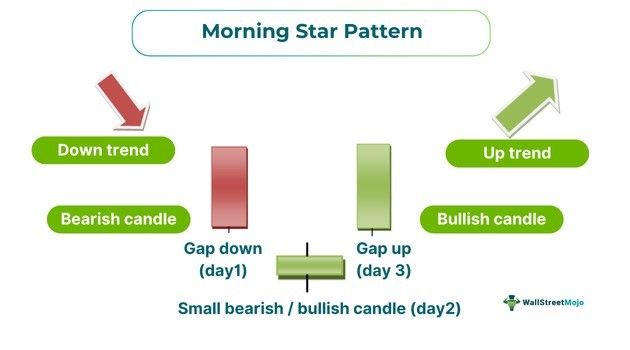
As mentioned earlier, the morning star shows a downtrend, and the bears will initially be in control. The market continuously tends to make new lows during the period. On day one of the star patterns, the market forms a long red candle by making a new low, representing heightened sale activity. The second day of the pattern shows a gap-down ending where bears dominate the scene again.
After the gap-down opening, the situation remains the same, resulting in a doji or a spinning top, showing that uncertainty is prevailing in the market. This becomes a contrast to the expectations of another down day. On the third day, the stock opens with a gap, followed by a candle that closes above the first-day red candle’s opening. This gap-up opening encourages buying behavior and covers the loss incurred on day one. This bullish scenario is expected to continue for the next few trading sessions, and investors look forward to buying before the prices shoot up.
Note: There are gaps in the market when there is a sudden decrease or increase in the stock price and when there is no trading activity. A gap-up happens when the following day’s opening price is higher than the previous day’s high price.
How To Trade?
Candlestick patterns help traders and investors analyze market movements and place trades. The Relative Strength Index (RSI) indicator aids traders and investors in comprehending the pace and momentum of a security’s price movement. A trader can open a long position if the RSI indicator reaches 30 levels while the pattern forms. A Bollinger Band is another option traders can use to confirm a trade. The main purpose of Bollinger Bands is to show if a stock is oversold or overbought. A morning star pattern is further confirmed if the second candlestick forms below the lower Bollinger Band and the third candlestick forms above the lower Bollinger Band. With the help of the earlier indicators, traders can decide on buying, selling, or even holding. They are interpretational tools and do not come with foolproof guarantees, as investments carry inherent risks.
A morning star pattern is a bullish reversal; a downtrend is present, so the initial candle is bearish. Given that the bulls and bears have begun to balance each other out, the second candle will be volatile and can show both a bullish and a bearish trend. Strong bullish candlesticks should form on the third candle, confirming a reversal. This display of three candles makes up the pattern.
Examples
Check out the following examples for a better idea:
Example #1
Dan is a trader who was observing the market to buy stocks. He observed the ABC Ltd. stocks and started trading on Monday. On Monday, the stock’s closing price was $10. Even though there was a prevailing downtrend in the stock price with a gap down, Monday night saw the announcement of ABC Ltd. entering into a sales contract with a major company.
The market sentiments were positive, as they anticipated good results from this contract. This naturally meant that buyers were ready to buy, and as a result, the stock price jumped to $15 on Tuesday, meaning there was no trading activity between $10 and $15, and it directly jumped to $15. He noticed a gap-up opening due to the prevailing bullish sentiment and understood that a pattern was formed. He saw a downtrend with a gap down in one day; the next day, both bullish and bearish sentiment prevailed, after which signs of a bullish trend were seen. This is the pattern of a star candlestick, and he decides to buy the stocks immediately before the prices rise.
They manipulated financial statements and inflated revenues considerably. They were busted when one of the regulatory authorities noticed non-corresponding account receivables or changes in inventory. The CFO and other employees faced criminal charges, and the company paid a hefty fine.
Example #2
Bitcoin has reclaimed its $20,000m (2023) per coin mark after a series of bearish prices. A few years prior, it had confirmed the pattern of the morning star and begun its two-year-long bull run. In that period (2015), the cryptocurrency increased its price by 6000%. This happened in a span of 24 months.
For professional-grade stock and crypto charts, we recommend TradingView – one of the most trusted platforms among traders.
Disclosure: This article contains affiliate links. If you sign up through these links, we may earn a small commission at no extra cost to you.
Frequently Asked Questions (FAQs)
Is the morning star pattern bullish?
Yes, it is a bullish pattern. It reverses the downturn(bearish prices) and leads to an increase in prices. It occurs at the bottom end after a series of declines.
How strong is the Morning Star pattern?
There aren’t any benchmarks or values to compare. These are patterns and were observed throughout time. An upswing will eventually follow downtrends as cyclical trends tend to persist. These patterns demonstrate the impending time and strongly indicate an upcoming bullish trend.
What are the morning star and evening star patterns?
Evening star patterns are connected to the peak of a price rise, indicating that the uptrend will end soon. The morning star pattern, which is seen as a bullish indication, is in stark contrast to the evening star pattern.
Is the morning star pattern good for stocks?
The Morning Star is regarded as a positive sign about stocks due to the profit potential it brings. The evening star, on the other hand, is considered a negative sign.
Recommended Articles
Continue with these closely related articles from the same guide.