Table of Contents
What Is Inside Bar Pattern?
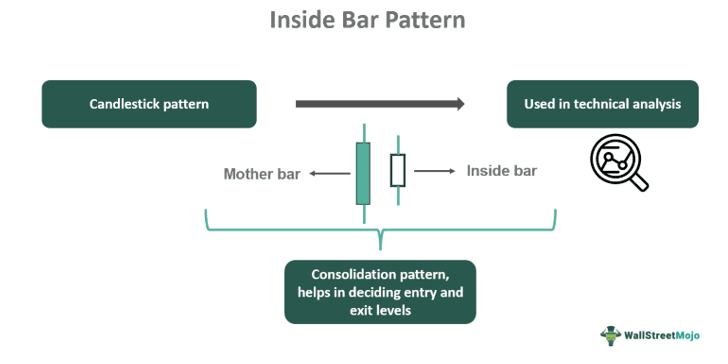
Inside bar pattern is a type of candlestick arrangement in which there is a combination of two candles, and the second candle is contained within the first one. The high of the second candle is lower than the first, and the low is higher than the low of the first.
It is widely used in the financial market for trading in stocks, indices, forex, or cryptocurrency. It is reliable during analysis of price action and can be used to decide the entry or exit levels. It represents price consolidation, and the trader should expect a breakout time.
Key Takeaways
- The inside bar pattern is a candlestick arrangement used in technical analysis, which represents price consolidation.
- Traders should keep watch for a breakout from this pattern and expect price volatility and trend reversal.
- In this pattern, there are two candles, and the first candle, referred to as the mother candle, engulfs the second candle.
- The first candle can be either green or red, but the second candle will always have a lower high and a higher low than the first candle.
Inside Bar Pattern Explained
Inside bar pattern refers to the candlestick arrangement where there are two consecutive candles and the first candle engulfs the second one. The first candle may be either green or red, but the high of the second will be lower than the first, and the low of the second will be higher than the first.
Traders use this strategy of bearish or bullish inside bar pattern to identify trend continuation or reversal and also to decide on the entry and exit points while taking trade. Since the inside candle or the second candle is small, it denotes that the market is currently having less volatility, and there is much consolidation in the process. If the trader wants to take a trade, then they need to wait for a breakout from this consolidation.
Whether the market will take a bullish or bearish turn in the near future will depend on the color of the mother candle or the first candle, and therefore, this pattern may be bullish or bearish. Bullish will happen if the preceding or mother candle is green, signaling that the market will follow a bullish trend in the near future. A bearish preceding or mother candle signifies that the future trend may be downward.
However, this should be used in combination with other indicators to get better confirmation of the market condition and make a profitable trade.
Characteristics Of An Inside Bar Strategy
Here are some characteristics of this bearish or bullish inside bar pattern.
- This pattern is mainly used and suitable in a daily chart, providing an accurate time gap for the candles to form. A shorter period will have other factors and influences, and a longer time will actually smoothen out the current market condition.
- It works best in a trending market so that traders can identify consolidation using this pattern and decide the next move.
- The size of the inside bar influences the trading strategy to a great extent. As per the traders and analysts, the smaller the inside bar, the greater the chance of accuracy in the market signal.
- Formation of this pattern immediately after the breakout is a good sign for traders because they can associate it with trend reversal. For upward reversals, they can go long, and downward reversal provides an opportunity to short the market.
Thus, the above are some essential characteristics of the strategy.
How To Identify?
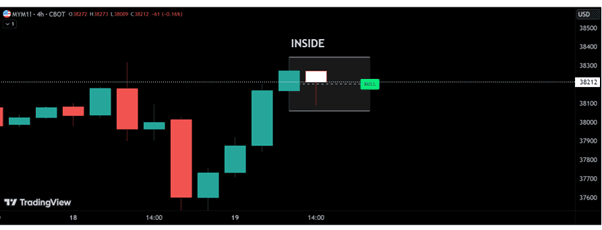
It is possible to understand the concept with the help of a chart from TradingView, as given below. In the chart below, the inside bar pattern is clearly marked. The second candle is totally inside the previous mother candle, and the high of the second is lower than the first candle, and the low of the second is higher than the first. However, in this case, it is a bullish pattern since the mother candle is green, and there is a possibility of a bullish continuation pattern in the market in the near future. Therefore, traders may decide to buy. However, it is always better to confirm such a decision by using a combination of other indicators that will confirm the move better.
How To Trade?
This section elaborates on the trading procedure using this pattern. The best approach is to place a stop loss at the high of the mother bar and short the market in case of a downtrend signal and place a stop loss at the low of the mother bar and go long in case of an uptrend signal. The entry should be at the breakout level of a bullish or bearish inside bar pattern, as the case may be. This is a standard entry that follows the trend.
Inside the bar, trading can also go against the trend. This usually happens when the pattern appears at the end of an uptrend or a downtrend, signaling a possible reversal. In such cases, traders should note that a critical support or resistance level is being tested. Such moves are typically very profitable because they are very significant, giving lucrative returns, provided the trader is able to identify the situation promptly and take a trade on time.
However, it should be noted that beginners should try to trade in the direction of the trend since that is less risky than trending in reversal patterns. Sometimes, two or more two inside bars may be spotted within the mother bar, which denotes that consolidation would be longer and the breakout may be more robust. Experience and a clear understanding of the process are vital in this case.
Examples
Here are some suitable examples to understand the concept of inside bar pattern scanner better.
Example #1
Jack is a long-term investor who is planning to invest in the stock of ABC Corporation for quite some time. He was unable to enter the market even though the stock was in an uptrend for the last six months. However, after a few days, he notices an inside bar pattern that signifies consolidation because stockholders are booking profits. He waits for a few days only to see a positive breakout, which suggests a bullish trend. This is supported by the fact that the mother candle is green and the inside candle is red, denoting a bullish trend in the near future. This gives him the opportunity to enter the market.
Example #2
A clear bearish inside bar pattern appeared in Nifty 50, signifying profit booking by existing investors. This has brought down the market by 13%, which analysts view as a situation where traders should wait and watch because there is strong resistance at the 22600 level, which may not allow the market to move up. Still, on the contrary, it may see a negative bias and down move. It is better to wait and look for a proper breakout.
Advantages And Disadvantages
Here are some advantages and disadvantages of the concept.
Advantages
- It is a pervasive pattern appearing in charts and used widely by traders for trading in stocks, cryptocurrencies, indices, etc.
- The single or double inside bar pattern may be used for both buying and selling. It is an indicator that suggests to traders what might be the possible entry and exit levels for that particular financial instrument. This increases the scope of trading in the financial market.
- It is a perfect strategy for trading in a trending market, and it also allows room for identifying possible breakout points in a rangebound market.
Disadvantages
- It is best suited for a daily time frame where the time gap is perfect. A shorter time frame will face more volatility effects, and a longer time frame will lead to a change in the current trends to a great extent, resulting in misleading interpretations.
- The single or double inside bar pattern may not always result in correct results. Therefore, it should be used in combination with other strong trend indicators for better confirmation.
Inside Bar Vs. Outside Bar
Both the above candlestick charts are frequently used for technical analysis, but there are some differences between them as follows:
- The primary difference is that the inside bar pattern scanner is a pattern where the first candle completely engulfs the second, and the latter is a pattern where the second candle engulfs the first candle.
- For trading purposes, using the former, the trader should look for a breakout and take a trade in that direction. For the latter, the trader should take trade in the direction of the closing of the bar.
Thus, the above are the primary and significant differences between the two types of patterns.
