Table of Contents
What Is Moving Average Crossover?
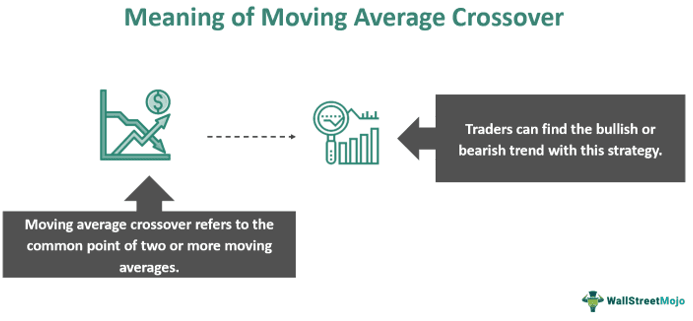
Moving average crossover is a trading strategy used to compare the two moving average prices of stock prices. It is mostly used in technical analysis as a trading indicator. It aims to identify the bull and sell signals of security prices.
In general, the moving average crossover strategy is derived from moving averages. In the moving average, the average price point of the stock over a specific period. However, with the crossover, it is possible to measure two different moving averages over a specific length of time. In short, it looks for an equilibrium range within the prices.
Key Takeaways
- Moving average crossover refers to the trading strategy involving more than one moving average. It considers a point of convergence or crossover.
- It is mostly used in technical analysis to determine the buy and sell signals. Also, it is easily implemented on the stock screener.
- The popular types of crossover strategies include moving average price and double MA crossover. However, golden and death crossovers are also some of the types.
- At times, these indicators may not be effective and might produce false trends.
Moving Average Crossover Explained
A moving average crossover indicator is a technical analysis indicator that compares two moving averages of a security price. It creates a crossover of two price ranges to find the average point. Here, the length of each moving average is different. Hence, it helps in identifying the buy and sell signals for a particular stock. So, if a stock moves above a certain range (or point), it indicates a bullish signal. Likewise, a range below a level leads to a bearish signal. However, the moving average crossover strategy does vary with the type.
The mechanism of a moving average crossover indicator usually includes two MAs at the same time. It means that there are two MAs with different momentum. One with a faster momentum but with a shorter time frame of around 15 days or less. Likewise, a slower momentum has a longer time frame of 50 days or more.
Now, the crossover occurs when the faster MA crosses the shorter one. When that happens, it cuts from below to above, causing a bullish signal. As a result, it indicates an upward trend that might happen soon. These crossovers can also act as a support or resistance to the price. Similarly, if it cuts from top to bottom, a resistance or bearish signal exists. Thus, it is possible to see a downward trend in that security.
Strategies
There are various moving average crossover strategies used in technical analysis by traders. Let us understand them in detail:
#1 - Moving Average Price Crossover
In this strategy, the crossover between the price and the moving averages is useful in determining the trend changes. It considers the crossover point of different prices to estimate the trend for the stock. Here, traders try to look at the 20- or 50-day moving average and decide on a crossover. For instance, as the price crosses the moving average (above), it indicates a bullish trend. In other words, the stock will rise high. Likewise, if the cross is visible below, it turns out to be a downward (or bearish) trend.
#2 - Double Moving Average Crossover
The double moving average crossover is akin to applying two MAs at the same time. In short, it utilizes the short-term and long-term MA for determining the crossover. Thus, when the shorter MA crosses the other one, it indicates a bullish trend. Otherwise, the opposite results in a bearish signal.
Alternatively, the situation of short-term MA crossing the long-term MA is also known as the golden cross. It creates a rapid price increase and bullish trends for the traders. Likewise, when MA crosses longer, it is also known as the death cross strategy. Here, the market has a high-selling moment where the prices drop to a very significant level.
How To Use?
Since few strategies can help traders determine the market trend, utilizing the strategy in the right way is also important. Unless a trader uses the right approach, it will be tough to identify bull or sell signals. So, let us see how to use these strategies and plot on the chart:
- Select the security and MA indicator: The foremost step in using any trading strategy is to choose a stock for which the trend is to be determined. Once decided, the next step is to search for indicators and select a moving average indicator.
- Choose two MAs of different time frames: The next step is to select two moving averages that have different time lengths. For example, a suitable time frame for a shorter MA is 10, 15, or 20 days. Likewise, for a long-term MA, it goes above 50, 100, or 200 days. However, it is to be noted that the short moving average will always be a time length less than the other, like 20 days/50 days.
- Spotting entry and exit points: Now, look for crossover points for the stock where the two MAs meet. In short, the shorter MA will cross above/ below the longer one. These points will technically serve as buy or sell signals for traders.
- Utilizing a risk management strategy: Lastly, traders can alternatively deploy a risk management strategy that can protect them from further losses. They can use stop-loss orders to prevent them from occurring.
Examples
Let us look at some examples of simple moving average crossover to comprehend the concept better:
Example #1
Suppose John is a trader operating in the equity stock market for the past seven years. He has an accumulated wealth of more than a million. However, he follows a strategy that actually helps him find whether to buy a stock or not. Also, John is able to determine the potential entry and exit points for both. And it is possible with the use of a moving strategy crossover strategy.
John was likely interested in Samunson stock, but was underrated as per his analysis. Further, he also felt the stock is turning bullish in recent times. So, with the use of MA crossover, John plotted two moving averages of 20 days and 50 days. Later, he looked for a crossover (or a meet point) for both. Here, in this case, the stock gave an upward signal. As a result, he bought a few quantities of the stock in advance. In the later stages, John's strategy became accurate, and the stock yielded higher returns.
Example #2
According to a recent news update as of July 2023, crypto enthusiasts predicted a bullish trend by observing the simple moving average crossover. While considering the 50-day and 100-day time frame, Bitcoin gave an upward trend and is still true to the current scenario. In 2024, even the experts feel the coin may cross $150,000 this year, also following a good rally driving other coins as well.
Pros And Cons
Following are the pros and cons of moving average crossover. Let us look at them in brief:
| Pros | Cons |
|---|---|
| It is easy to implement and use on the charts. | These indicators provide signals after the trend has started. Thus, opportunities might get missed. |
| Potentially, it helps to identify buy and sell signals. | In a market with no clear trend, the indicator may not produce accurate results. |
| Also, it reduces noise and short-term volatility while analyzing a stock. | The indicator might be slow to reflect results. |
| Traders can also use different timeframes to determine the bullish or bearish trend. | It might be less fruitful or ineffective in markets with range-bound or high volatility. |
