Part of our Technical Analysis Indicators guide
Pivot Point Meaning
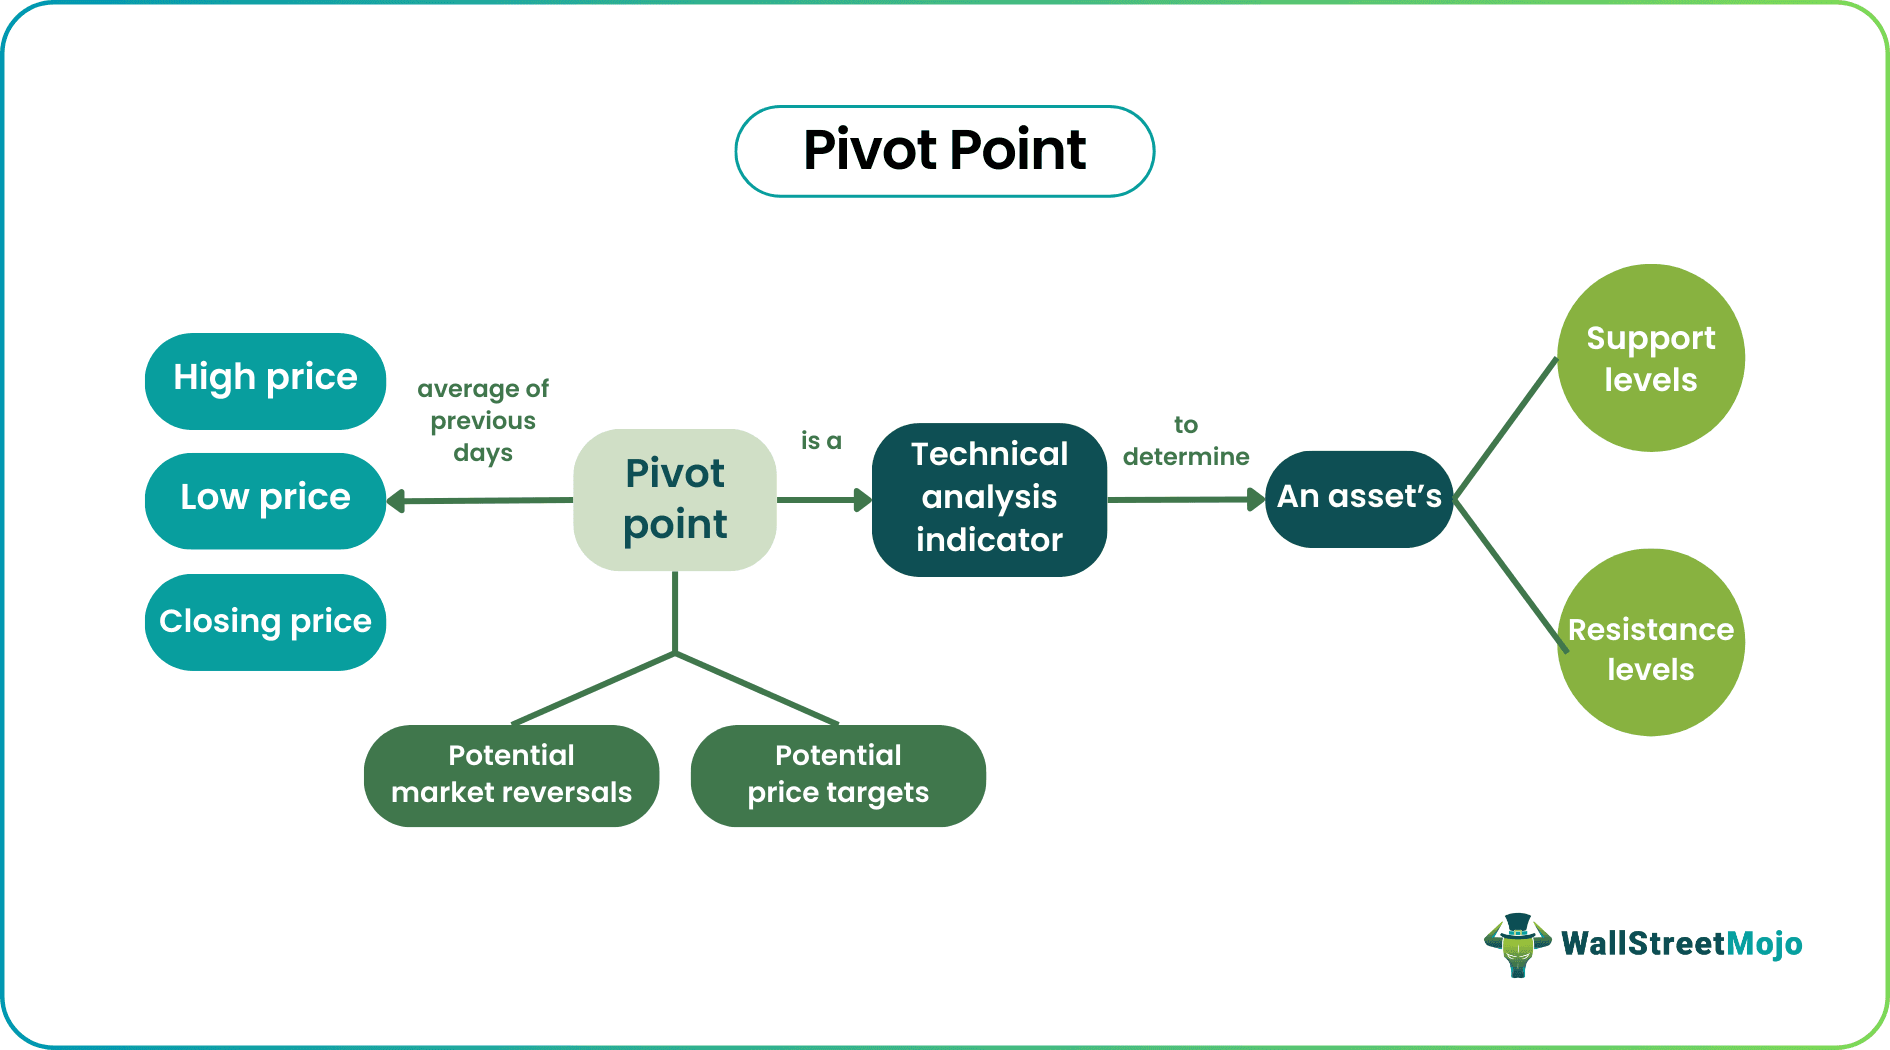
A pivot point is a technical analysis indicator commonly used in financial markets to determine potential support and resistance levels for an asset’s price movement. It is calculated based on the previous trading day’s high, low, and closing prices. It helps traders figure the market trends at various time points
In trading, the pivot points aim to identify potential levels for a stock‘s price movement. Their importance lies in helping traders make informed decisions based on these levels. Pivot points are commonly combined with other technical indicators to make trading decisions.
- Pivot points are a technical indicator identifying potential support and resistance levels for an asset’s price movement.
- The most common of them are Standard, Fibonacci, Camarilla, and Woodie
- Traders can use different types of them depending on their trading style and preferences, but it’s important to be consistent to avoid confusion.
- These points should be used with other technical indicators and fundamental analysis to confirm signals and make informed trading decisions. Professional traders use points as one of the many tools in their trading arsenal.
Pivot Point Trading Strategy Explained
A pivot point is the average of the previous day’s high, low, and closing prices. This calculation determines potential support and resistance levels for the current trading day. The pivot point is a reference point for traders to decide about buying or selling an asset.
In addition to the pivot point, several other support and resistance levels are calculated based on the pivot point. These are support levels S1, S2, and S3, and resistance levels R1, R2, and R3.
Traders use points to identify potential price levels where the market could reverse direction and determine potential price targets.
How To Use Pivot Point Trading Strategy?
To use pivot points in trading, one needs to follow these steps:
- First, identify the previous trading day’s high, low, and closing prices for the asset intended for trading.
- Calculate the point level by adding the high, low, and closing prices and dividing by three.
- Use the point level to calculate the support and resistance levels. There are different methods to calculate these levels, but a common method is to use the support and resistance level formulas.
- Monitor the asset’s price action relative to the support and resistance levels. If the price breaks through a support level, it could indicate a potential downward trend; if it breaks through a resistance level, it could indicate a potential upward trend.
- Use points with other technical indicators and fundamental analysis to make informed trading decisions.
Types
There are several types of pivot points used in trading. The most common types are:
- Standard Pivot Points: This is the most widely used type of pivot point, and it is calculated based on the previous day’s high, low, and closing prices.
- Fibonacci Pivot Points: Fibonacci points are calculated based on the Fibonacci sequence of numbers. These levels are derived from the high and low of the previous trading day and are used to identify potential levels of support and resistance.
- Camarilla Pivot Points: Camarilla pivot points are calculated using a different formula than standard pivot points. These levels are designed to provide tighter support and resistance and are commonly used in intraday trading.
- Woodie Pivot Points: Woodie points are calculated based on the previous day’s high, low, and opening prices. These levels identify potential support and resistance and are particularly useful in trending markets.
Formula
The formula to calculate pivot points is as follows:
Pivot Point = (High + Low + Close) / 3
Where:
- High = the highest price of the previous trading day
- Low = the lowest price of the previous trading day
- Close = the closing price of the previous trading day
Examples
Let us look at the examples to understand the concept better.
Example #1
Consider that on Monday, the closing price of a stock was $50. The high for the day was $55, and the low was $45. Thus, using these values, we can calculate the point and support and resistance levels for Tuesday’s trading:
Pivot Point = (High + Low + Close) / 3
= (55 + 45 + 50) / 3 = 50
Thus, based on this point level of 50, we can calculate the support and resistance levels for the next trading day:
- S1 = (2 x Pivot Point) – High S1 = (2 x 50) – 55 S1 = 45
- S2 = Pivot Point – (High – Low) S2 = 50 – (55 – 45) S2 = 40
- R1 = (2 x Pivot Point) – Low R1 = (2 x 50) – 45 R1 = 55
- R2 = Pivot Point + (High – Low) R2 = 50 + (55 – 45) R2 = 60
In this example, the point level is 50, the support levels are 45 & 40, and the resistance levels are 55 & 60. Hence, traders would use these levels to make trading decisions based on how the stock price behaves relative to the support and resistance levels.
Example #2
Consider a forex trader who is analyzing the EUR/USD currency pair. The trader observes that the EUR/USD has been trending downward for the past few days but is approaching a key point of 1.1800. The trader knows that if the EUR/USD breaks below this level, it could continue to decline further, but if it bounces off this level, it could reverse and rise.
To confirm their analysis, the trader looks at other technical indicators, such as moving averages and oscillators, suggesting that the EUR/USD is oversold and due for a bounce. Based on this analysis, the trader decides to place a buy order at 1.1800 with a stop loss at 1.1750, just below the point level.
A few hours later, the EUR/USD bounces off the point level and rises, confirming the trader’s analysis. As a result, the trader decides to move their stop loss up to break even to reduce the risk of the trade and continues to monitor the price action to determine when to take profits.
In this example, the point level is a key reference point for the trader to make trading decisions. Therefore, it is combined with other technical indicators to confirm the analysis and determine the currency pair’s potential support and resistance levels.
For professional-grade stock and crypto charts, we recommend TradingView – one of the most trusted platforms among traders.
Disclosure: This article contains affiliate links. If you sign up through these links, we may earn a small commission at no extra cost to you.
Frequently Asked Questions (FAQs)
1. Which pivot points are best for intraday?
Camarillas are commonly used for intraday trading, providing tighter support and resistance. However, testing and finding the points that work best for your trading strategy is important.
2. What is the pivot point in Forex?
In forex trading, it is a technical indicator used to determine potential support and resistance levels for a currency pair’s price movement based on the previous day’s high, low, and closing prices.
3. When to buy with a pivot point?
Traders may consider buying when the price of an asset breaks above a resistance level identified by a point, as it could indicate a potential upward trend. Other technical indicators and fundamental analysis should be used to confirm signals.
4. Which pivot points are best for swing trading?
Standard Points and Fibonacci Points are commonly used for swing trading, as they provide potential support and resistance for longer-term trends. Therefore, testing and finding the points that work best for your trading strategy is important.
Recommended Articles
This article has been a guide to Pivot Point and its meaning. Here, we explain the topic in detail with how to use it, its examples, types, and formula. You may also find some useful articles here –
Recommended Articles
Continue with these closely related articles from the same guide.