What is Portfolio Standard Deviation?
Portfolio Standard Deviation refers to the volatility of the portfolio, which is calculated based on three important factors that include the standard deviation of each of the assets present in the total Portfolio, the respective weight of that individual asset in the total portfolio, and the correlation between each pair of assets of the portfolio.
Key Takeaways
- Portfolio standard deviation quantifies the volatility of a portfolio. Computed using the correlation between asset pairs, individual asset standard deviations, and asset weights.
- To gauge portfolio risk, analyze asset standard deviations, their proportional weights, and correlations. Together, they provide insights into potential fluctuations.
- A portfolio with elevated standard deviation signifies heightened risk and unpredictable returns. Comparing portfolios, standard deviation highlights stability and volatility disparities.
- While a high standard deviation indicates risk, it may also correlate with higher potential returns. Investors evaluate standard deviation alongside potential rewards for balanced decision-making.
Interpretation of Standard Deviation of Portfolio
This helps in determining the risk of an investment vis a vis the expected return.
- Portfolio Standard Deviation is calculated based on the standard deviation of returns of each asset in the portfolio, the proportion of each asset in the overall portfolio, i.e., their respective weights in the total portfolio, and also the correlation between each pair of assets in the portfolio.
- A high portfolio standard deviation highlights that the portfolio risk is high, and the return is more volatile and, as such, unstable.
- A Portfolio with a low Standard Deviation implies less volatility and more stability in the returns of a portfolio and is a very useful financial metric when comparing different portfolios.

Example
Raman plans to invest a certain amount of money monthly in one of the two funds he has shortlisted for investment purposes.
Details of which are reproduced below:
- Assuming that stability of returns is most important for Raman while making this investment and keeping other factors constant, we can easily see that both funds have an average rate of return of 12%; however, Fund A has a Standard Deviation of 8, which means its average return can vary between 4% to 20% (by adding and subtracting eight from the average return).
- On the other hand, Fund B has a Standard Deviation of 14, which means its return can vary between -2% to 26% (by adding and subtracting 14 from the average return).
Thus, based on his risk appetite, if Raman wishes to avoid excess volatility, he will prefer investment in Fund A to Fund B as it offers the same average return with less volatility and more stability of returns.
| Particulars | Fund A | Fund B |
|---|---|---|
| Average Rate of Return for the Last 3 Years | 12% | 12% |
| Standard Deviation | 8 | 14 |
Standard Deviation of Portfolio is important as it helps analyze an individual asset’s contribution to the Portfolio. Standard Deviation is impacted by the correlation with other assets in the portfolio and its proportion of weight in the portfolio.
Portfolio Standard Deviation – Video Explanation

How to Calculate Portfolio Standard Deviation?
Portfolio Standard Deviation calculation is a multi-step process and involves the below-mentioned process.
Portfolio Standard Deviation Formula
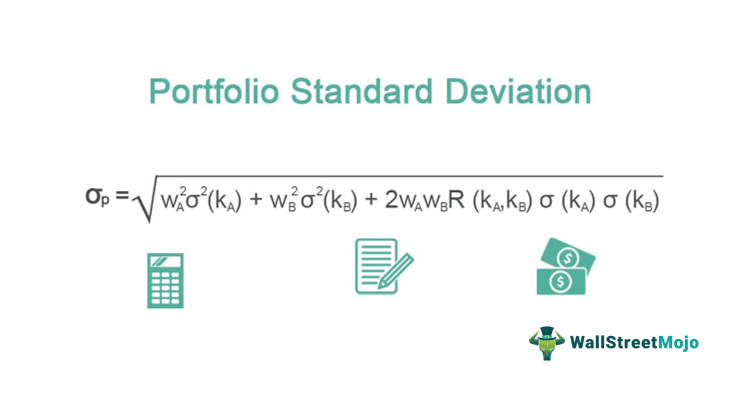
Assuming a Portfolio comprising of two assets only, the Standard Deviation of a Two Asset Portfolio can be computed using Portfolio Standard Deviation Formula:
- Find the Standard Deviation of each asset in the portfolio
- Find the weight of each asset in the overall portfolio
- Find the correlation between the assets in the portfolio (in the above case, between the two assets in the portfolio). Correlation can vary in the range of -1 to 1.
- Apply the values in those as mentioned above to derive the Standard Deviation formula of a Two Asset Portfolio.
Let’s understand the portfolio standard deviation calculation of a three-asset portfolio with the help of an example:
Calculating Portfolio Standard Deviation of a Three Asset Portfolio
1) – Flame International is considering a Portfolio comprising three stocks, namely Stock A, Stock B & Stock C.
Brief Details provided are as follows:
| Particulars | Weight Age in Portfolio | Expected Return | Standard Deviation |
|---|---|---|---|
| Stock A | 55% | 8% | 24% |
| Stock B | 25% | 4% | 18% |
| Stock C | 20% | 3% | 15% |
2) – The correlation between these stock’s returns is as follows:

3) – For a three-asset portfolio, this is computed as follows:

- Where wA, wB, and wC are weights of Stock A, B, and C, respectively, in the portfolio.
- Where kA, s kB, s kC are Standard Deviation of Stock A, B, and C, respectively, in the portfolio.
- Where R(kA, kB), R(kA, kC), and R( kB, kC) are the correlation between Stock A and Stock B, Stock A and Stock C, Stock B, and Stock C, respectively.

- Standard Deviation of Portfolio: 18%
- Thus we can see that the Standard Deviation of the Portfolio is 18% despite individual assets in the portfolio with a different Standard Deviation (Stock A: 24%, Stock B: 18%, and Stock C: 15%) due to the correlation between assets in the portfolio.
Conclusion
Portfolio Standard Deviation is the standard deviation of the rate of return on an investment portfolio and is used to measure the inherent volatility of an investment. It measures the investment’s risk and helps analyze a portfolio’s stability of returns.
Standard Deviation of the Portfolio is an important tool that helps match a Portfolio’s risk level with a client’s risk appetite. It measures the total risk in the portfolio comprising both the systematic risk and Unsystematic Risk. A larger standard deviation implies more volatility and more dispersion in the returns and, thus, is riskier. It helps measure the consistency in which returns are generated and is a good measure to analyze the performance of Mutual funds, and Hedge Funds returns consistency.
However, it is pertinent to note that Standard Deviation is based on historical data, and Past results may predict future results. Still, they may also change over time and, therefore, can alter the Standard Deviation, so one should be more careful before making an investment decision based on the same.
Frequently Asked Questions (FAQs)
1. What is the importance of portfolio standard deviation?
Portfolio standard deviation is crucial in assessing investment risk. It quantifies the degree of variability in a portfolio’s returns, enabling investors to gauge the potential fluctuations in value. A lower standard deviation signifies more stable returns, while a higher one indicates greater volatility. By understanding standard deviation, investors can make informed decisions about risk tolerance, diversification, and asset allocation, aligning their portfolios with their risk preferences.
2. What are the applications of portfolio standard deviation?
Portfolio standard deviation finds various applications. It aids in constructing well-diversified portfolios by considering assets with low correlations, reducing overall risk. It assists in comparing different investment options, helping investors choose those aligning with their risk appetite. Additionally, financial professionals use it to optimize risk-adjusted returns, as it enables them to balance risk and potential rewards effectively.
3. What is a good standard deviation?
A good standard deviation depends on the investor’s risk tolerance and investment objectives. Generally, a lower standard deviation implies less risk and is preferred for conservative investors. However, risk-tolerant investors might accept a higher standard deviation for potentially higher returns. A good standard deviation aligns with the investor’s comfort level and financial goals while considering the potential for both gains and losses.
Recommended Articles
This has been a guide to Portfolio Standard Deviation and its interpretation with examples. Also, we learn how to calculate the standard deviation of the portfolio (three assets). You may learn more about Asset Management from the following articles –