Part of our Descriptive Statistics guide
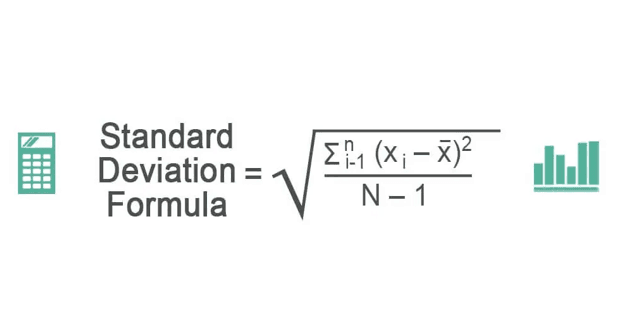
What is Standard Deviation Formula?
Standard Deviation (SD) is a popular statistical tool represented by the Greek letter ‘σ.’ It measures the amount of variation or dispersion of a set of data values relative to its mean (average), thus interpreting the reliability of the data. If smaller, the data points lie close to the mean value, thus showing reliability.
In finance, the standard deviation formula statistics are used to determine the relative riskiness of an asset. A volatile asset class usually has a high standard deviation indicating higher risk and vice versa for an asset class or a particular stock such as blue chip stocks with fundamentals on the stable side tend to have lesser risk.
Key Takeaways
- Standard Deviation (SD), denoted by the symbol σ, is a widely used statistical tool. It measures the variation or dispersion of data values in relation to their mean, providing insights into the data’s reliability.
- A smaller standard deviation indicates that data points are clustered closely around the mean, indicating higher reliability. Conversely, a larger standard deviation signifies greater dispersion of data points from the mean.
- Standard deviation finds significant application in portfolio management, where it helps assess a portfolio’s overall risk and return.
- It is a commonly employed and practiced concept in various industries.
Standard Deviation Formula Explained
The standard deviation formula is a statistical tool that determines the dispersion or diversion of a particular set of data in comparison to its mean. It is often found that a standard deviation formula sample is calculated as a square root of the diversion or variance.
In finance, however, investors, analysts, and market experts rely on standard deviation to assess the relative risk of a particular stock or an asset. A risky or volatile asset has a relatively higher standard deviation, whereas relatively stable assets or stocks like blue chip stocks have a lower standard deviation.
A lower standard deviation of a stock indicates that the dispersion of its market value is not too far from its mean or central market value. In the stock market, volatility is generally associated with the perceived risk of the stock, Therefore, this formula helps investors and analysts alike to assess the risk involved in investing in a particular stock.
However, this formula accounts for all uncertain events within the data set as risk. Therefore, the only consistent downside according to experts of this formula is that even if the investor makes returns above the average return predicted, it is accounted as a risk.
Formula
Let us understand the standard deviation formula statistics by first understanding the formula. The formula shall act as a basis for all the related concepts we would discuss in this article.
The formula of standard deviation is below
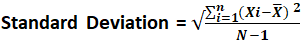
Where:
- xi = Value of each data point
- x̄ = Mean
- N = Number of data points
Standard deviation is most widely used and practiced in portfolio management services. For example, fund managers often use this basic method to calculate and justify their variance of returns in a particular portfolio.
A high standard deviation of a portfolio signifies a large variance in a given number of stocks in a particular portfolio. On the other hand, a low standard deviation signifies less stock variance among themselves.
A risk-averse investor will only be willing to take any additional risk if they compensate by an equal or a larger return to take that particular risk.
A more risk-averse investor may not be comfortable with his standard deviation. As a result, they would want to add safer investments, such as government bonds or large-cap stocks in the portfolio or mutual funds, to diversify the portfolio’s risk and its standard deviation and variance.
The variance and the closely-related standard deviation measure how spread out a distribution is. In other words, they are measures of variability.
How To Calculate?
Let us understand a standard deviation formula sample through the step-by-step calculation process explained below.
- First, the mean of the observations is calculated just like the average adding all the data points available in a data set and dividing it by the number of observations.
- Then, the variance from each data point measures the mean. It can come as a positive or negative number, the value is squared, and the result is subtracted by one.
- The squar of the variance calculated from Step 2 is taken to calculate the standard deviation.
Examples
Let us understand standard deviation formula statistics with the help of a few examples. These examples will help us understand the intricacies of the concept in detail.
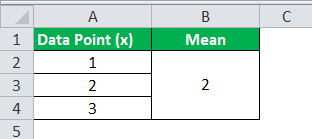
Example #1
The data points are 1,2, and 3. What is the standard deviation of the given data set?
Solution:
Use the following data for the calculation of the standard deviation.
So, the calculation of variance will be –
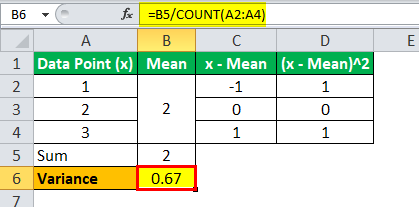
Variance = 0.67
The calculation of standard deviation will be –
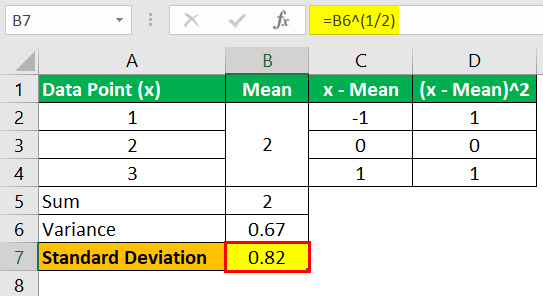
Standard Deviation = 0.82
Example #2
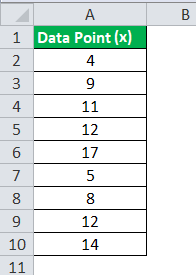
Find the standard deviation of 4,9,11,12,17,5,8,12,14.
Solution:
Use the following data for the calculation of the standard deviation.
The calculation of the mean will be –
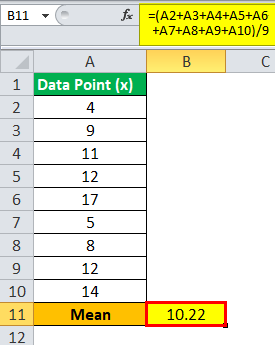
First, find the mean of the data point 4+9+11+12+17+5+8+12+14/9
Mean = 10.22
So, the calculation of variance will be –
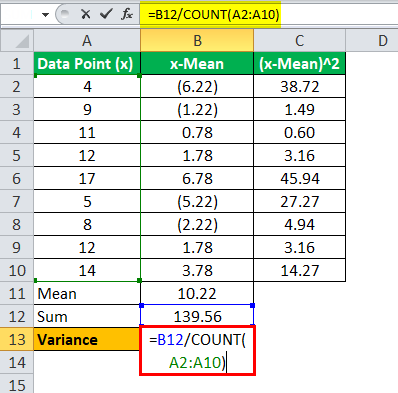
The variance will be –
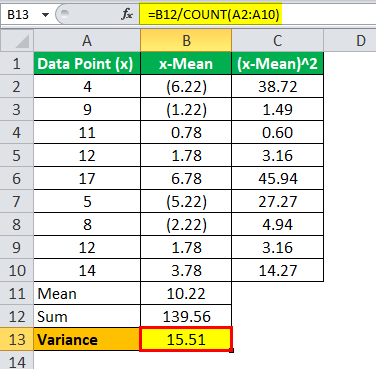
Variance = 15.51
The calculation of standard deviation will be –
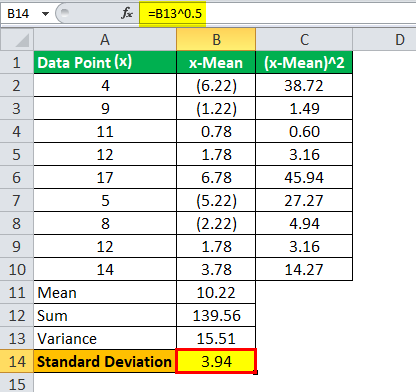
Standard Deviation = 3.94
Variance = Square root of standard deviation.
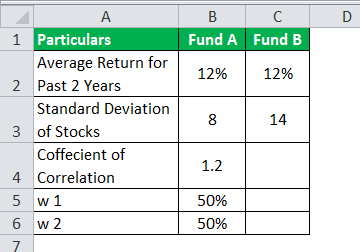
Example #3
Use the following data for the calculation of the standard deviation.
So, the calculation of variance will be –
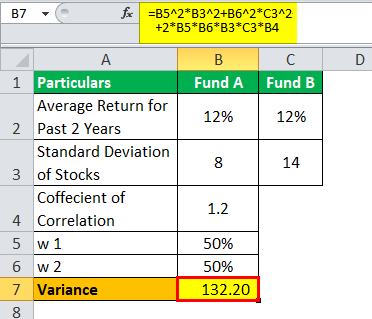
Variance = 132.20
The calculation of standard deviation will be –

Standard Deviation = 11.50
Portfolio managers frequently use this type of calculation to calculate the risk and return of the portfolio.
Relevance and Uses
Now that we know the fundamentals and implications of the concept, it is important to also understand the uses and interpretation as well to fully know the concept. Let us understand the relevance and uses of the standard deviation formula sample through the points below.
- Standard deviation is historically helpful in analyzing a portfolio matrix’s overall risk and return. It is widely used and practiced in the industry. The correlation and the weights of the portfolio’s stocks can impact the portfolio’s standard deviation.
- As the correlation of the two asset classes in a portfolio reduces the portfolio’s risk, it is not necessary all the time that an equally weighted portfolio provides the least risk in the universe.
- A high standard deviation may be a measure of volatility, but it does not necessarily mean that such a fund is worse than one with a low standard deviation. For example, if the first fund is a much higher performer than the second one, the deviation will not matter much.
- Standard deviation is also used in statistics and is widely taught by professors at various top universities worldwide. However, the formula for standard deviation is changed when one uses it to calculate the sample’s deviation.
- The equation for SD in Sample = just the denominator is reduced by 1.
Frequently Asked Questions (FAQs)
What are the assumptions associated with the standard deviation formula?
The standard deviation formula assumes that the data is normally distributed or follows a bell-shaped curve. It also assumes that the dataset represents the entire population rather than a sample. Additionally, the formula assumes that the data points are independent and unrelated to each other.
What are the limitations of the standard deviation formula?
The limitations of the standard deviation formula include its sensitivity to outliers. Outliers, which are extreme values in the dataset, can significantly impact the standard deviation and may not accurately represent the spread of the majority of the data. Moreover, the standard deviation does not provide information about the shape of the distribution or the presence of skewness.
What is the standard deviation formula vs. variance formula?
The standard deviation formula and the variance formula are closely related. The variance formula calculates the average squared deviation from the mean, while the standard deviation formula is the square root of the variance. The variance formula sums the squared differences between each data point and the mean, divided by the number of data points. The standard deviation formula takes the square root of the variance to give a measure of dispersion in the original units of the data, making it more interpretable and easier to compare across datasets.
Recommended Articles
This article is a guide to the Standard Deviation Formula. Here, we learn how to calculate standard deviation using its formula, practical examples, and a downloadable Excel template. You can learn more about financial modeling from the following articles: –