Table of Contents
What Is A Rounded Bottom Pattern?
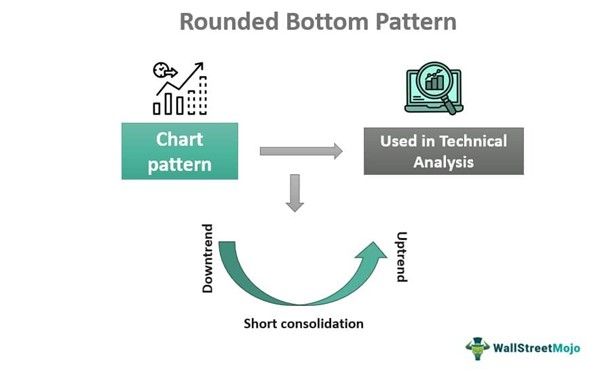
Rounded Bottom Pattern is a chart pattern commonly identified and used in technical analysis. Traders interpret it as a price reversal signal. It typically appears at the end of a downtrend.
The shape of the pattern gives the appearance of a saucer or bowl, and it forms over a few days or weeks or sometimes even over a month. Traders should also consider the volume of trade taking place at that time for better confirmation. Along with reversal, it also states the price direction.
Key Takeaways
- Rounded bottom pattern appears in technical charts and is used for price and trend analysis.
- It appears at the end of a downtrend and denotes that prices have the possibility of reversal upwards in the near future.
- It takes the shape of a saucer or bowl, and along with good volume to indicate confirmed price action.
- Traders can assume that the existing downtrend is about to come to an end and a new uptrend is about to commence for the financial instrument.
Rounded Bottom Pattern Explained
Rounded Bottom Pattern is a candlestick arrangement used in technical analysis that takes the appearance of a bowl or a saucer at the bottom. It is seen at the end of a prolonged downtrend and denotes that the prices have a strong possibility of moving up very soon.
Typically, it appears in weekly charts, but they may also appear in daily or monthly ones. After a prolonged downtrend and consolidation, the prices of the financial instrument show a bullish bias marked by candlestick patterns that form higher highs and higher lows.
The initial part of the rounded bottom stock pattern shows a fall in prices through a downtrend for quite a few trading sessions, which forms the low of the pattern. Then, the lowest low is seen; it may or may not be one trading session. Then the highs start forming, giving the shape of a saucer. Both the downtrend that forms the left side and the uptrend that forms the right side of the pattern should take approximately the same time.
Finally, the pattern shows a breakout from the level at which the prices had initially started declining and forming the rounded bottom shape. This breakout level is often considered as a support, based on which traders take trades.
However, it is not a standalone indicator and should be used in combination with other price indicators for better confirmation.
How To Identify?
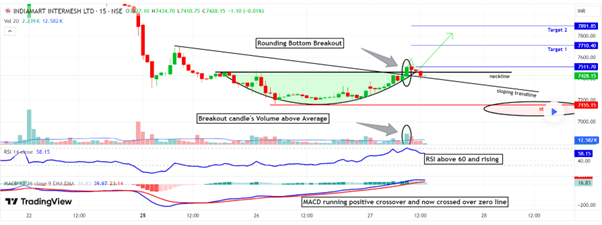
It is possible to understand the concept of rounded bottom stock pattern with the help of a chart from TradingView, as given below. In Indiamart's chart, a rounded bottom is clearly visible and marked in green. From the neckline, the candlesticks show a downtrend that forms the left side of the pattern and continues to a level, after which it again starts moving upwards. The downtrend on the left is an area that traders may use to enter a short position and take advantage of price decline to make profits.
However, on the right, the uptrend continues and finally breaks out above the neckline, which is marked by a green arrow. This breakout is the entry point, after which traders can expect quite a good upward movement in prices. The entire pattern is in the shape of a saucer, and at breakout, a good volume is also visible in the histogram chart. It is to be noted that both MACD and RSI show a positive trend in supporting the upward price movement.
How To Trade?
The trading strategy involves a systematic approach to the pattern, which can be summarized in the steps below.
Step #1 - In the first step, the trader must identify the pattern accurately and ensure that all criteria are met, with an initial downtrend, then a rounded bottom with a decrease in trading volume, and finally an uptrend with a breakout with a considerable volume.
Step #2 - The pattern says that after a prolonged downtrend, there will be a short consolidation with a rounded bottom and then an uptrend with a breakout. This breakout with good volume is the point of entry for the trader. They should be ready to enter a long position at this level.
Step #3 - The next step is deciding on the stop loss. This will depend on the trader's risk appetite. But typically, the breakout point or a support level very near to it is the stop loss level. This is the point where the trader will exit the trade in case the price moves contrary to their expectation.
Step #4 - Then, the trader will fix the price target. For this, the height from the bottom to the breakout level is taken and added to the breakout level upwards. However, this price target level is not guaranteed, but it serves as an estimate.
Step #5 - It is essential to calculate the risk-reward ratio too. This will ensure that the profit is more than the risk of loss. Typically, the reward risk should be 2:1.
Step #6 - Next, the trader has to understand up to what size or volume they will take the trade. This will again depend on risk tolerance and financial ability.
Step#7 - Taking a trade is not about just entering the market and exiting it at a predefined price level. The exit level may change depending on market conditions. Therefore, it is essential to monitor the price patterns and exit trade whenever required.
Step #8 - Finally, the trader should be ready to exit the trade as soon as the price target is reached to book profits. However, the trader should be flexible in their approach.
Examples
It is possible to understand the concept with the help of some suitable examples, as given below:
Example #1
Jack is a long-term investor who has been tracking the stock of ABC Pharma for quite some time because of its good financials and prospects in the field of medicine. The stock showed a downtrend for almost a month, and then there was continuous consolidation for a week. Then Jack notices a few higher highs and higher lows. This continued for almost a month, and finally, there was a breakout at the level where the stock had initially started to come down more than two months back.
Thus, this is an example of a rounded bottom. At this breakout point, Jack noticed an excellent volume and bought 400 stocks. After about six months, the stock price reached Jack’s targeted price, and he sold them to earn profits.
Example #2
HCL Technologies, which is a giant in the IT space, has formed a rounded bottom and is likely to hit its highest price point. Analysts have expressed a very positive outlook on the stock, and traders are looking for a perfect long-term position. This may be the highest level for the stock to date, and the market is showing a very positive sentiment regarding its future trend.
Benefits
Some benefits of the concept are given below:
- It is an exemplary process for predicting trends and price direction. Traders can decide the future trade based on the direction and volume.
- It gives an early indication of the price pattern, which is helpful in planning trade on time, depending on the reversal.
- The entry and exit points are easy to denote and identify from this process.
- Potential unfavorable and highly volatile markets are tough to trade in. So traders can use this pattern to stay away from such markets and trade with less risk in favorable price trends. This also helps them get a competitive advantage in the market.
- Since this pattern gives information about the open, high, low, and close prices, the pattern is easy to interpret and make trade-related decisions.
Limitations
Here are some limitations of the process.
- Sometimes, it is very confusing to detect, and traders get misguided due to sudden changes in market price conditions.
- It cannot be used as the only indicator to decide about trend changes. It has to be combined with other reliable ones for better confirmation.
- It is not suitable for detailed information regarding the financial instrument or the industry. It just gives information about trend direction, breakout, and volume.
- It does not always consider vital factors influencing prices, like corporate conditions, news releases and events, political impact, etc. Therefore, it is not always dependable.
Rounded Bottom Pattern Vs. Rounded Top Pattern
Both the above patterns signify trend changes along with volume. However, some notable differences between them are as follows:
- The former forms a saucer-like shape at the bottom of the pattern, and for the latter, the saucer-like shape appears at the top of the pattern.
- The former is a signal for a future uptrend, and the latter is a signal for a future downtrend.
- For the former, the pattern starts with a downtrend, makes a bottom, and then forms an uptrend. For the latter, it is just the opposite.
- For the former, the initial price direction is suitable for a short position, and then after the breakout, the trader can take a long position. The process is just the opposite for the latter.
