What Is Stock Beta?
Stock Beta is one of the statistical tools that quantify the volatility in the prices of a security or stock concerning the market as a whole or any other benchmark used to compare the security performance. It is a component of Capital Asset Pricing Model (CAPM) used to calculate the expected returns of an asset based on the underlying Beta, risk-free rate, and the risk premium.
Stock beta value of greater than one indicates that the stock stands a good chance of delivering returns better than the average market returns indicated by the index. However, a stock with the value lesser than one indicates that the volatility of the stock might be lesser than that of a stock above one.
Stock Beta Explained
Stock beta refers to the returns of a particular stock in relation to the market returns. For ease in comparison and practicality, the index of the stock market acts as the comparison metric.
It may look like an overly mathematical formula, but it does provide both qualitative and quantitative actionable information. The sign (positive or negative) indicates the direction of the movement of the stock in question concerning that of the underlying market or benchmark against which the stock’s movement is assessed.
The Stock Beta can have three types of values:
Key Takeaways
- Beta < 0: If the Beta is negative, this implies an inverse relationship between the stock and the underlying market or the benchmark in comparison. Both stock and the market or the benchmark will move in the opposite direction in a negative stock beta scenario.
- Beta = 0: If the Beta is equal to zero, then this implies no relationship between the movement of the returns of the stock and the market or the benchmark. Hence, both are too dissimilar to have any common pattern in price movements.
- Beta > 0: If the Beta is greater than zero, there is a strong direct relationship between the stock and the underlying market or the benchmark. Both stock and the market or the benchmark will move in the same direction. Some further insight is as follows:
- Beta between 0 and 1 implies that the stock is less volatile than the underlying market of the benchmark.
- The beta of 1 implies that the volatility of the stock is the same as that of the underlying market or the index in both qualitative and quantitative terms.
- A beta of greater than 1 implies that the stock is more volatile than the underlying market or index.
A negative Beta is possible but highly unlikely. Most investors believe that gold and stock based on gold tend to perform better when the market dives. Whereas a Beta of zero is possible in the case of government bonds acting as risk-free securities providing a low yield to the investors. And a Beta of greater than zero is the most common scenario we see in the investment world. Most of the stocks follow this pattern.
It is one single statistical tool that investors frequently use to assess the risk that the stock may add to their portfolio, allowing them to gauge the risk in qualitative and quantitative terms and assess the risk and rewards associated with the stock. Then, using their analysis of Beta and their market insight, the investors can take action regarding the stock.
Formula
The stock’s Beta is calculated as the division of covariance of the stock’s returns and the benchmark’s returns by the variance of the benchmark’s returns over a predefined period.
Below is the formula to calculate stock beta value.
Stock Beta Formula = COV(Rs,RM) / VAR(Rm)
Here,
- Rs refers to the returns of the stock
- Rm refers to the returns of the market as a whole or the underlying benchmark used for comparison
- Cov(Rs, Rm) refers to the covariance of the stock and market
- Var(Rm) refers to the Variance of market
If we focus on the components that go into the calculation of Stock Beta, it will become much more evident that:
- It helps assess the direction of movement of the stock concerning the direction of the movement of the market or the benchmark used for the comparison.
- How sensitive or volatile is the stock’s price movement concerning the market or the benchmark?
One more important thing worth mentioning is that there should be some relation between stock and the market or the benchmark used for the comparison, as otherwise, the analysis would serve no purpose. For example, an oil company stock and an index weighted majorly by technology companies would not have many relationships as the businesses are too dissimilar to compare. Hence, no practical insight may come out of the Beta calculation between the two.
How To Calculate?
Let us calculate the stock beta value of a NASDAQ Listed company MakeMyTrip (MMTY).
The benchmark index is NASDAQ.
Download the stock prices and NASDAQ index prices for the past couple of years.
Steps to Calculate Stock Beta are as follows
Download the stock prices and NASDAQ index prices for the past couple of years.
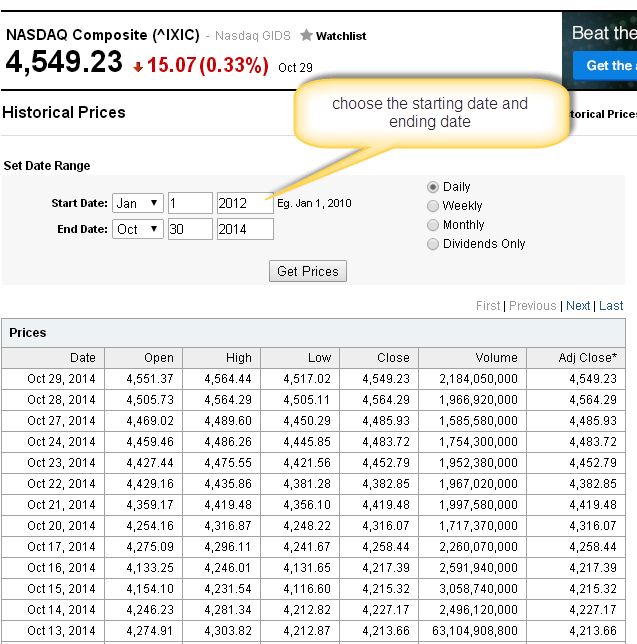
For NASDAQ, download the dataset from Yahoo Finance.
Likewise, download the corresponding stock price data for the MakeMyTrip example from here.Sort the data in the requisite format.
Please format the data as per the details provided below.
Prepare an excel sheet with stock price data and NASDAQ data.

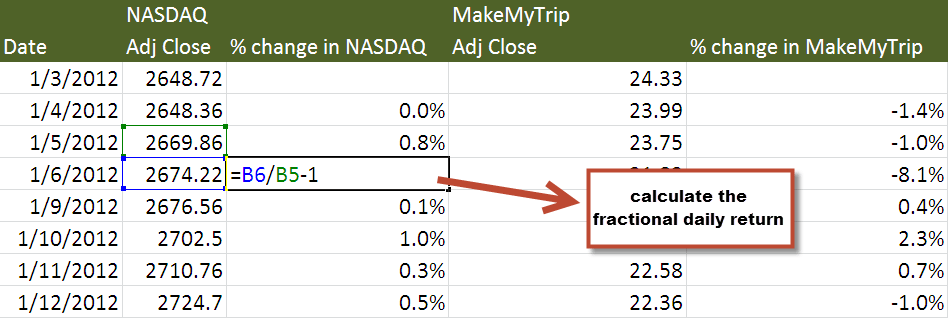
Calculate the percentage change in Stock Prices and NASDAQ.

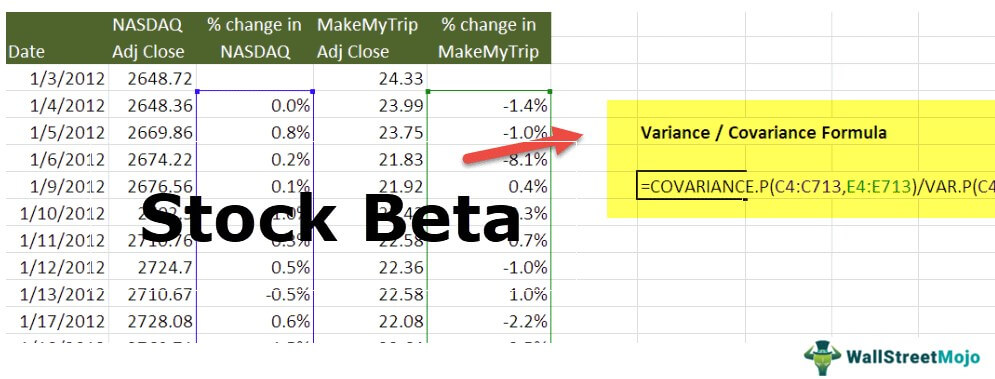
Calculate Stock Beta using the Variance/Covariance Formula.

Using the variance-covariance stock beta formula, we get the Beta as 0.9859 (Beta Coefficient)


Recommended Articles
This article has guide to what is Stock Beta. Here we discuss Stock Beta formula and how to calculate stock beta (step by step) along with examples. You can learn more about it from the following articles –