What is Covariance?
Covariance is a statistical measure used to find the relationship between two assets. One may calculate it as the standard deviation of the return of the two assets multiplied by its correlation. If it gives a positive number, the assets have positive covariance, i.e., when the returns of one asset go up, the return of the second asset also goes up, and vice versa for negative covariance.
In financial parlance, the term “covariance” is primarily in portfolio theory. It refers to measuring the relationship between the returns of two stocks or other assets. It can be calculated based on returns of the stocks at different intervals and the sample size or the number of intervals in a covariance formula sample.
Key Takeaways
- Covariance is a statistical tool to search the relationship between two assets.
- It can be computed by multiplying the correlation by the standard deviation of the return on the two assets. The assets have positive covariance if the result is positive. The situation is reversed for negative covariance.
- One may also utilize it to find the stock movement vis-à-vis the benchmark index.
Covariance Formula Explained
The covariance formula in statistics and finance is used to determine the relationship between two variables. That is, when both variables move in the same direction, it results in a positive covariance and when both these variables move in different directions, it results in a negative covariance.
A finance covariance formula is similar to a correlation formula that deals with the assessment of data points from the average value within a data set. The use of this metric in finance is majorly applied to the portfolio theory.
If a stock moves in a negative direction while the index is moving positively, it shows that the stock has something either fundamentally wrong or is going through a cyclical change in the market.
Therefore, if an asset that does not show significant positive covariance can be eliminated to avoid any unsystematic risk.
Formula
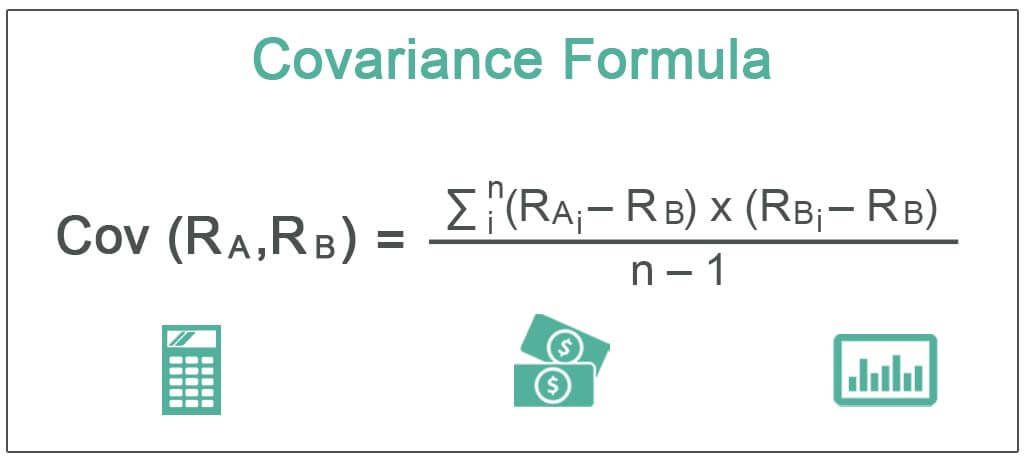
Let us understand the covariance formula sample by first understand the formula to calculate and assess the movements of variables. This factor will help us understand other related concepts through the article.

where
- RAi =Return of stock A in the ith interval
- RBi =Return of stock B in the ith interval
- RA=Mean of the return of stock A
- RB=Mean of the return of stock B
- n = Sample size or the number of intervals
The covariance calculation between stock A and stock B can also be obtained by multiplying the standard deviation of returns of stock A, the standard deviation of returns of stock B, and the correlation between stock A’s and stock B’s returns. Mathematically, it represents as,
Cov (RA, RB) = ρ(A, B) * ơA * ơB
where ρ(A, B) = Correlation between returns of stock A and stock B
- ơA = Standard deviation of returns of stock A
- ơB = Standard deviation of returns of stock B
How To Calculate?
The application of the finance covariance formula that we have discussed below has been explained in detail. This will help us calculate the movement of variables within a data set to determine the action to be taken based on the outcome.
The calculation of covariance between stock A and stock B can be derived using the the following steps:
Firstly, determine the returns of stock A at different intervals, and they are denoted by RAi, which is the return in the ith interval, i.e., RA1, RA2, RA3,….., RAn are the returns for 1st, 2nd, 3rd,….. and nth interval.
Next, determine the returns of stock B at the same intervals and they are denoted by RBi
Next, calculate the mean of the returns of stock A by adding all the returns of stock A and then dividing the result by the number of intervals. It is denoted by RA.

Next, calculate the mean of the returns of stock B by adding all the returns of stock B and then dividing the result by the number of intervals. It is denoted by RB

Finally, the calculation of covariance is derived based on returns of both the stocks, their mean returns, and the number of intervals, as shown above.
The calculation of covariance between stock A and stock B can also be derived by using the second method in the following steps:
Step 1: Firstly, determine the standard deviation of the returns of stock A based on the mean return, returns at each interval, and several intervals. It is denoted by ơA.
Step 2: Next, determine the standard deviation of the returns of stock B, and it is denoted by ơB.
Step 3: Next, determine the correlation between the returns of stock A and that of stock B by using statistical methods such as the Pearson R test. It is denoted by ρ(A, B).
Step 4: Finally, the covariance calculation between stock A and stock B can be derived by multiplying the standard deviation of returns of stock A, the standard deviation of returns of stock B, and the correlation between returns of stock A and stock B, as shown below.
Cov (RA, RB) = ρ(A, B) * ơA * ơ
Example
Let us understand a covariance formula sample with the help of an example with detailed calculations that will help us understand the intricacies of the concept.
Let us take the example of stock A and stock B with the following daily returns for three days.

Determine the covariance between stock A and stock B.
Given, RA1 = 1.2%,RA2 = 0.5%,RA3 = 1.0%
RB1= 1.7%,RB2 = 0.6%,RB3 = 1.3%
Therefore, the calculation will be as follows,

Now, mean return of stock A,RA= (RA1 + RA2 + RA3 ) / n
- RA= (1.2% + 0.5% + 1.0%) / 3
- RA= 0.9%

Mean Return of Stock B, RB= (RB1 +RB2+ RB3 ) / n
- RB= (1.7% + 0.6% + 1.3%) / 3
- RB= 1.2%
Therefore, one can calculate the covariance between stock A and stock B as:
= [(1.2 – 0.9) * (1.7 – 1.2) + (0.5 – 0.9) * (0.6 – 1.2) + (1.0 – 0.9) * (1.3 – 1.2)] / (3 -1)
Covariance between Stock A and Stock B will be –
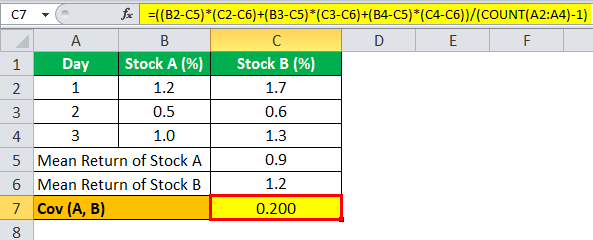
- Cov (RA, RB) = 0.200
Therefore, the correlation between stock A and stock B is 0.200, which is positive. As such, both returns move in the same direction, i.e., either with positive or negative returns.
Relevance and Uses
Despite the fact that the finance covariance formula is used primarily for portfolio analysis, it plays a major role in determining the future of the asset in the portfolio and helps the investor mitigate their risk and have a deeper understanding of their investments.
From the perspective of a portfolio analyst, it is vital to grasp the concept of covariance because it is primarily used in portfolio theory to decide which assets are to be included in the portfolio. It is a statistical tool to measure the directional relationship between the price movement of two assets, such as stocks. One can also use it to ascertain the movement of a stock vis-à-vis the benchmark index, i.e., whether the stock price goes up or goes down with the increase in the benchmark index or vice versa. This metric helps a portfolio analyst reduce a portfolio’s overall risk. A positive value indicates that the assets move in the same direction, while a negative value indicates that the assets move in opposite directions.
Frequently Asked Questions (FAQs)
Can covariance be negative?
The covariance can be from negative to positive values. A positive covariance shows that the two variables may move together. With the same sign, a negative covariance displays that the two variables may go in the opposite direction
Why is covariance significant?
One may use covariance to maximize diversification in an assets portfolio. The overall risk is rapidly reduced by adding assets with a negative covariance to a portfolio. In addition, it also provides a statistical measurement of the risk for a mix of investments.
Are covariance and correlation the same?
Covariance and correlation are two contrasting terms. One may use it in statistics and regression analysis. Covariance indicates how the two variables may vary. In contrast, correlation displays how the two variables are associated.
Can covariance be greater than 1?
Contrary to correlation, covariance values do not possess a limit between -1 and 1. Thus, it may be wrong to cease that there may be a high relationship between variables when the covariance is high. The covariance size values are based on the difference between values in variables.
Recommended Articles
This article has been a guide to what is Covariance Formula. Here we explain how to calculate it, examples, Excel template, relevance, and uses in detail. You can learn more about financing from the following articles: –