Table of Contents
What Is Symmetrical Triangle?
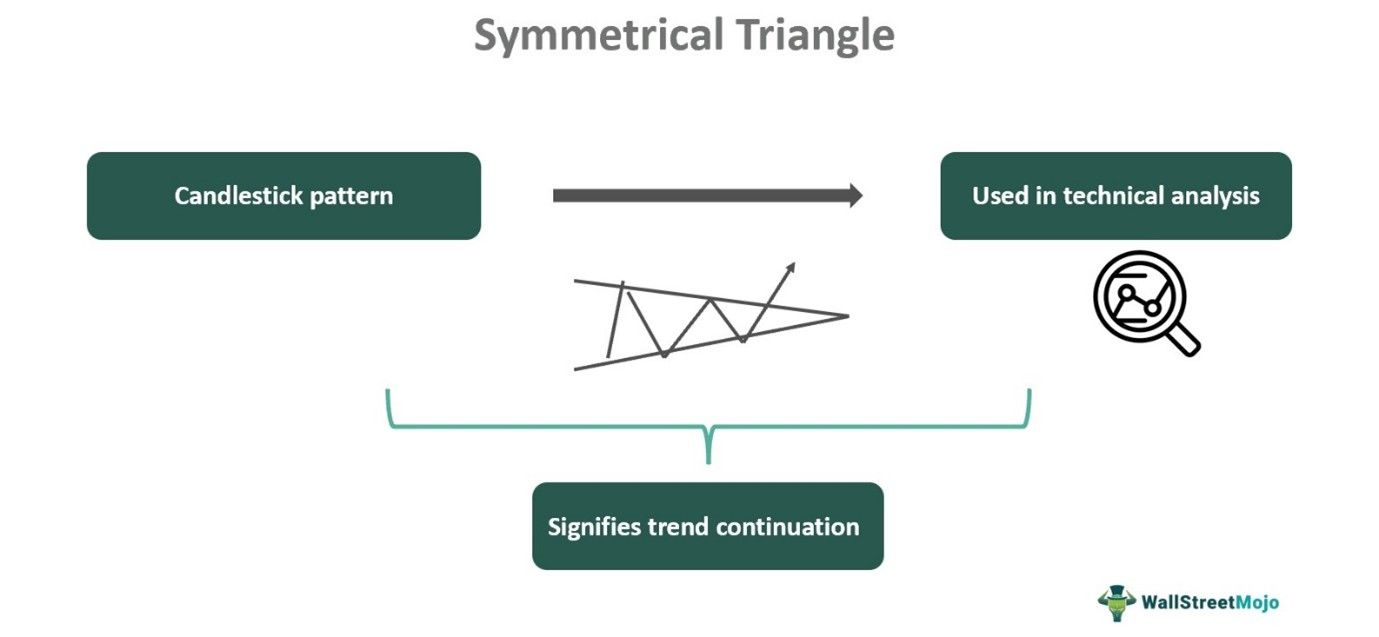
Symmetrical triangle is a candlestick pattern that is commonly used in technical analysis, which connects a series of lower highs and higher lows to extend and form a triangle. The upper and lower trend lines converge to meet at a particular point.
They typically mark a continuation of the trend that is already going on. However, if there is a change in trend, it will be marked by a breakout from the triangle, either upwards or downwards. However, traders should understand the concept clearly before using it and combine it with other indicators for better confirmation.
Key Takeaways
- Symmetrical triangle pattern is a type of candlestick arrangement within a chart that is frequently used in trading in the financial market.
- Traders use it to make profitable investments after combining it with various other technical indicators.
- The figure shows a triangle where an upper trend line touches two or more lower highs and a lower trend line touches two or more higher lows to meet at a point.
- The figure shows a triangle where an upper trend line touches two or more lower highs and a lower trend line touches two or more higher lows to meet at a point.
Symmetrical Triangle Explained
Symmetrical triangle is a candlestick arrangement that appears in a chart and represents a triangle where two trend lines meet. This is widely used among traders, and it signifies that the market will continue with its current trend without any change unless there is a breakout.
In the formation of a symmetrical triangle pattern, two or more lower highs are connected using an upper trend line, and two or more higher lows are connected using the lower trend line. Both these merge and meet at a point to complete a triangle pattern. However, this happens only when the asset prices fluctuate within a small range and gradually diminish in volatility.
This pattern is much different from the ascending and descending triangles, and the difference lies in the slope of the trend lines, which will be elaborated on in the later part of the article. However, it is similar to pennants and flags since all of them signal trend continuation. However, is it advisable not to use it as a standalone indicator but to combine it with others to get a clear picture of the market?
How To Identify?
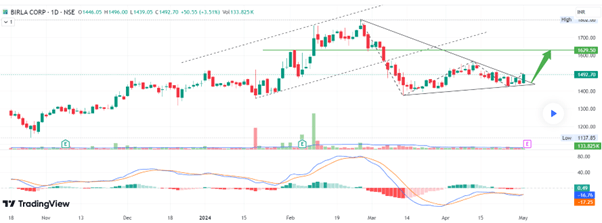
The symmetrical triangle pattern is easy to identify and understand using a chart from TradingView, as given below. In the daily chart of Birla Corporation, a symmetrical triangle is clearly visible, which started at the end of February 2024. The upper trend line has met two lower highs, and the lower trend line has met two higher lows, finally meeting almost on 30th April. During this period, the market has not shown much volatility, except for price fluctuation within the trend lines. But then there is a green positive breakout candle at the end. This symmetrical triangle breakout signifies that there is a possibility of an up move in the stock in the near future with a fresh bullish pattern.
However, below the candlestick chart, there is the MACD line, which is a good indicator that can be combined with this pattern to get a clear signal.
How To Trade?
Trading using this pattern is not very complex but requires a clear understanding of the reason for its formation and the possible next price move in the market. The trader has to successfully identify this pattern in the chart by looking at the consolidation period, which will typically end with a breakout, either up or down. The pattern should not be ascending or descending because that signifies a different market move, which will be elaborated below.
The trader needs to wait for a breakout to take place. Otherwise, there is no room to take a trade at this point since this pattern denotes a simple continuation. It is necessary to spot a breakout to make a trade decision. Along with that, it is also essential to track the volume of trade. If the volume traded is high, it is a confirmation and support for the breakout. Low trading volume is not a very strong confirmation to take trade.
With confirmation from the volume, the trader will enter a trade in the direction in which the symmetrical triangle breakout has taken place. If the trader’s risk appetite is less and is conservative, then they will prefer to wait for the next candle to appear, which will support the current breakout trend.
It is always an excellent approach to have a stop loss in place, just beyond the opposite trendline, that will protect the trader from the risk of loss in case the market does not go as anticipated.
Additional Features
Some additional features of the triangle pattern are given below:
#1 - Ascending Triangle Pattern
In this pattern, the triangle has a bullish appearance when moving upwards. The upper trend line touches two or more highs that are usually at almost the same level, but the lower trend line touches two or more higher lows. There is a flat upper and rising lower trend lines for this triangle. It suggests buying momentum is more.
#2 - Descending Triangle Pattern
In this pattern, the triangle has a bearish appearance when moving downwards. The upper trend line touches two or more lower highs, but the lower trend line touches two or more lows, usually at almost the same level. There is a rising upper and flat lower trend line for this triangle. It suggests selling momentum is more.
Examples
Here are some examples to understand the concept of symmetrical triangle pattern trading.
Example #1
John is a long-term investor who has ABC Corporation stock in his portfolio. He has noticed that the stock has not shown many changes in its price movement in the last six months, but its volatility is showing a decreasing trend. He checks the daily chart of the stock only to find a symmetrical triangle formed during the last three months. But he decides to wait and, after a week, spots a breakout with a small red candle on the downside. However, being a conservative trader, he waits for two more trading sessions. He gets a confirmation with another red candle on the upside, along with the RSI showing an overbought position at the 70 level. At this point, he decides to sell off his holding.
Example #2
As per the forecast regarding the prices of natural gas, it drops to low levels for five days and is ready to test the support trend line. It has formed a symmetrical triangle over some time and is now testing the lower trend of the triangle. If this continues and there is a negative breakout outside the triangle, then traders should either exit the market or take a short position at this point and should look for the next support level before deciding on the trade.
Advantages And Disadvantages
The symmetrical triangle pattern trading has its advantages and disadvantages, which have been elaborated on below:
Advantages:
- The pattern is very suitable for identifying entry and exit points within the chart, which traders use to make trade decisions.
- It is suitable for both long-term trading objectives and short-term trading objectives.
- The pattern is applicable to all kinds of assets, which may be stocks, bonds, commodities, currency, etc.
- Traders can trace consolidation patterns and reversal points, understand the volatility levels, and make trades based on these factors.
- Traders can also calculate the price targets and the levels up to which they can expect to earn profits by adding the distance between the two trend lines to the level at which the breakout happened.
- This pattern is helpful in understanding the direction of the market and accordingly taking trades that will be more manageable and will have minimum risk with maximum profits.
Disadvantages:
- It is not a standalone indicator and should be used in combination with other technical indicators to get clarity.
- The candlestick pattern of a symmetrical triangle stock perceived by traders can vary and is entirely subjective. Different traders may interpret it in different ways, leading to varied results.
- It may give false breakouts, leading to incorrect trade decisions. This reduces its reliability as an indicator.
- Even though it signals the direction of the trend and the time at which it may happen, it does not say anything about how long the trend may continue in the direction of the breakout.
Symmetrical Triangle Vs. Pennant Pattern
Both the above patterns denote a possible reversal of a trend. But there are some differences between them as follows:
- The former is a triangle that is formed when two trend lines converge and meet at a particular point after a series of up and down price movements within a trend line. However, the latter forms due to sudden and sharp price movement, which looks similar to a symmetrical triangle.
- The former looks like an extended triangle, but the latter has a somewhat smaller appearance.
- For the symmetrical triangle stock, the volume will slowly decrease as the triangle approaches the converging point, reflecting the fact that the market is not sure about the next move and suddenly increases at the breakout. However, the latter is not much different from the former in this respect.
- The former signals an extended consolidation phase till the breakout, after which trading should be done. For the latter, the consolidation period is short, and the market expects that prices will move in the direction of pennant formation.
