Table Of Contents
Excel VBA Charts
We can term charts as objects in VBA. Similar to the worksheet, we can also insert charts in VBA. First, we select the data and chart type we want for our data. Now, there are two different types of charts we provide. One is the embed chart, where the chart is in the same sheet of data. Another is known as the chart sheet, where the chart is in a separate data sheet.
In data analysis, visual effects are the key performance indicators of the person who has done the analysis. Visuals are the best way an analyst can convey their message. Since we are all Excel users, we usually spend considerable time analyzing the data and drawing conclusions with numbers and charts. Creating a chart is an art to master. We hope you have good knowledge of creating charts with excel. This article will show you how to create charts using VBA coding.
How to Add Charts using VBA Code in Excel?
#1 - Create Chart using VBA Coding
To create any chart, we should have some numerical data. For this example, we are going to use the below sample data.

First, let us jump to the VBA editor.
Step 1: Start Sub Procedure.
Code:
Sub Charts_Example1()
End Sub
Step 2: Define the variable as Chart.
Code:
Sub Charts_Example1()
Dim MyChart As Chart
End Sub
Step 3: Since the chart is an object variable, we need to Set it.
Code:
Sub Charts_Example1()
Dim MyChart As Chart
Set MyChart = Charts.Add
End Sub
The above code will add a new sheet as a chart sheet, not a worksheet.

Step 4: Now, we need to design the chart. Open With Statement.
Code:
Sub Charts_Example1()
Dim MyChart As Chart
Set MyChart = Charts.Add
With MyChart
End With
End Sub
Step 5: The first thing we need to do with the chart is to Set the source range by selecting the “Set Source Data” method.
Code:
Sub Charts_Example1()
Dim MyChart As Chart
Set MyChart = Charts.Add
With MyChart
.SetSourceData
End With
End Sub
Step 6: We need to mention the source range. In this case, my source range is in the sheet named “Sheet1,” and the range is “A1 to B7”.
Code:
Sub Charts_Example1()
Dim MyChart As Chart
Set MyChart = Charts.Add
With MyChart
.SetSourceData Sheets("Sheet1").Range("A1:B7")
End With
End Sub
Step 7: Next up, we need to select the kind of chart we are going to create. For this, we need to select the Chart Type property.
Code:
Sub Charts_Example1()
Dim MyChart As Chart
Set MyChart = Charts.Add
With MyChart
.SetSourceData Sheets("Sheet1").Range("A1:B7")
.ChartType =
End With
End Sub
Step 8: Here, we have a variety of charts. I am going to select the “xlColumnClustered” chart.
Code:
Sub Charts_Example1()
Dim MyChart As Chart
Set MyChart = Charts.Add
With MyChart
.SetSourceData Sheets("Sheet1").Range("A1:B7")
.ChartType = xlColumnClustered
End With
End Sub
Now let’s run the code using the F5 key or manually and see how the chart looks.

Step 9: Now, change other properties of the chart. To change the chart title, below is the code.

Like this, we have many properties and methods with charts. Use each one of them to see the impact and learn.
Sub Charts_Example1() Dim MyChart As Chart Set MyChart = Charts.Add With MyChart .SetSourceData Sheets("Sheet1").Range("A1:B7") .ChartType = xlColumnClustered .ChartTitle.Text = "Sales Performance" End With End Sub
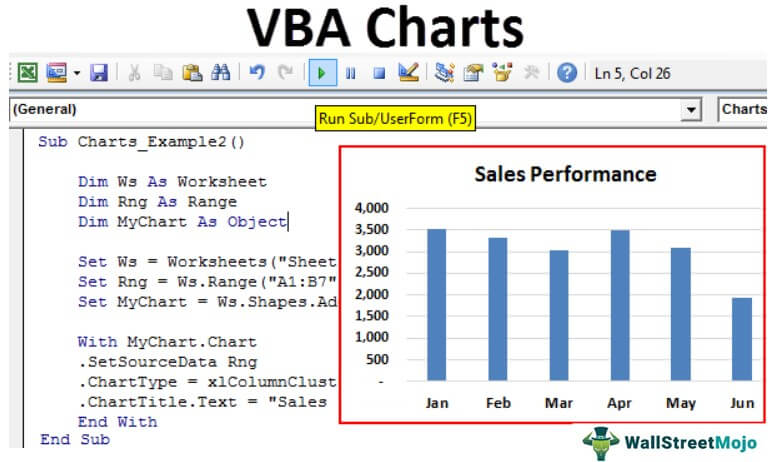
#2 - Create a Chart with the Same Excel Sheet as Shape
We need to use a different technique to create the chart with the same worksheet (datasheet) as the shape.
Step 1: First, declare three object variables.
Code:
Sub Charts_Example2()
Dim Ws As Worksheet
Dim Rng As Range
Dim MyChart As Object
End Sub
Step 2: Then, set the worksheet reference.
Code:
Sub Charts_Example2()
Dim Ws As Worksheet
Dim Rng As Range
Dim MyChart As Object
Set Ws = Worksheets("Sheet1")
End Sub
Step 3: Now, set the range object in VBA
Code:
Sub Charts_Example2()
Dim Ws As Worksheet
Dim Rng As Range
Dim MyChart As Object
Set Ws = Worksheets("Sheet1")
Set Rng = Ws.Range("A1:B7")
End Sub
Step 4: Now, set the chart object.
Code:
Sub Charts_Example2()
Dim Ws As Worksheet
Dim Rng As Range
Dim MyChart As Object
Set Ws = Worksheets("Sheet1")
Set Rng = Ws.Range("A1:B7")
Set MyChart = Ws.Shapes.AddChart2
End Sub
Step 5: Now, as usual, we can design the chart using the “With” statement.

Code:
Sub Charts_Example2() Dim Ws As Worksheet 'To Hold Worksheet Reference Dim Rng As Range 'To Hold Range Reference in the Worksheet Dim MyChart As Object Set Ws = Worksheets("Sheet1") 'Now variable "Ws" is equal to the sheet "Sheet1" Set Rng = Ws.Range("A1:B7") 'Now variable "Rng" holds the range A1 to B7 in the sheet "Sheet1" Set MyChart = Ws.Shapes.AddChart2 'Chart will be added as Shape in the same worksheet With MyChart.Chart .SetSourceData Rng 'Since we already set the range of cells to be used for chart we have use RNG object here .ChartType = xlColumnClustered .ChartTitle.Text = "Sales Performance" End With End Sub
It will add the chart below.

#3 - Code to Loop through the Charts
Like how we look through sheets to change the name, insert values, and hide and unhide them. Similarly, we need to use the ChartObject property to loop through the charts.
The below code will loop through all the charts in the worksheet.
Code:
Sub Chart_Loop() Dim MyChart As ChartObject For Each MyChart In ActiveSheet.ChartObjects 'Enter the code here Next MyChart End Sub
#4 - Alternative Method to Create Chart
We can use the below alternative method to create charts. We can use the ChartObject. Add method to create the chart below is the example code.
It will also create a chart like the previous method.
Code:
Sub Charts_Example3() Dim Ws As Worksheet Dim Rng As Range Dim MyChart As ChartObject Set Ws = Worksheets("Sheet1") Set Rng = Ws.Range("A1:B7") Set MyChart = Ws.ChartObjects.Add(Left:=ActiveCell.Left, Width:=400, Top:=ActiveCell.Top, Height:=200) MyChart.Chart.SetSourceData Source:=Rng MyChart.Chart.ChartType = xlColumnStacked MyChart.Chart.ChartTitle.Text = "Sales Performance" End Sub