


A forex chart can be as simple as a line showing the latest EUR/USD price or as complex as a multi-timeframe workspace filled with indicators, drawings, technical levels, and market data.
The right charting website therefore depends on what a trader is trying to accomplish.
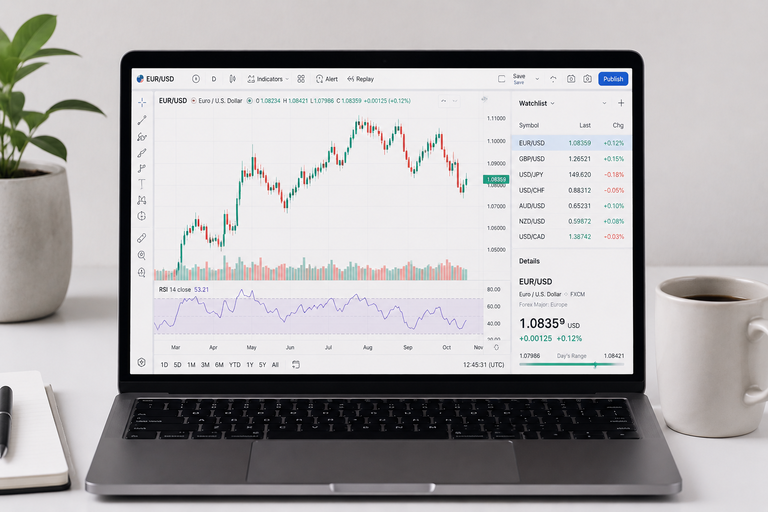
Some traders need an advanced technical-analysis workspace. Others want to quickly check a currency pair and understand why it is moving. Some rely heavily on economic data, while others prefer to compare charts with market news or trading ideas.
In 2026, traders can choose from dedicated charting platforms, forex research websites, financial portals, and macroeconomic databases.
This guide looks at several different approaches and explains where TradingView, FXStreet, Investing.com, MetaTrader.com, Barchart, Trading Economics, and Yahoo Finance fit into a forex research workflow.
What Do You Actually Need From a Forex Chart?
Before comparing websites, it helps to separate charting into several different tasks.
A technical trader may need:
- multiple timeframes;
- technical indicators;
- drawing tools;
- alternative chart types;
- saved layouts;
- instrument comparison.
A fundamental forex trader may care more about economic releases, central-bank decisions, interest rates, inflation, and financial news.
Another trader may simply want to open EUR/USD, check what happened during the day, read related market information, and move on.
No website is equally strong in all three scenarios.
That is why comparing charting services only by the number of indicators can be misleading.
TradingView
TradingView is the obvious starting point for traders who want the chart itself to function as their primary analytical workspace.
Its Supercharts environment supports a large collection of technical indicators, drawing tools, custom intervals, instrument comparison, saved layouts, and more than 20 chart types.
The available visualizations extend beyond conventional candlestick and line charts to include Renko, Kagi, Point & Figure, Range, Heikin Ashi, volume footprint, and other specialized formats.
For forex traders who spend a large part of their research process manually studying charts, this flexibility is a major advantage.
TradingView also has Pine Script, allowing users to create custom indicators and analytical tools.
Where it fits
TradingView makes the most sense when technical analysis begins and ends inside the chart.
A trader can build a complex EUR/USD layout, maintain technical drawings, add several studies, compare timeframes, and then save that environment for future sessions.
Its community also publishes public trading ideas for currency pairs, giving users an additional layer of analysis around the chart.
The trade-off is complexity.
A trader who only wants to see how EUR/USD moved today and read the latest context may not need such an extensive charting environment.
FXStreet
FXStreet approaches charts from a different direction.
Forex is at the center of the website rather than one asset class among many.
Its interactive charting environment covers currencies alongside commodities, cryptocurrencies, indices, and US stocks. FXStreet currently describes the service as providing more than 6,000 graphs, 19 timeframes, and over 100 technical indicators.
The larger advantage, however, is what surrounds the chart.
FXStreet provides forex news, currency analysis, forecasts, exchange-rate information, central-bank coverage, and an extensive economic calendar.
This makes it particularly relevant to traders who combine technical analysis with macroeconomic events.
A practical example
Suppose EUR/USD suddenly becomes more volatile.
A technical chart can show the move.
FXStreet can also help a trader investigate whether the move occurred around an ECB announcement, Federal Reserve communication, inflation release, employment report, or another macroeconomic event.
That combination makes FXStreet less of a pure charting application and more of a specialized forex research environment.
Investing.com
Investing.com is useful when forex needs to be viewed as part of the wider financial market.
Its coverage extends across currencies, stocks, commodities, indices, bonds, ETFs, futures, and cryptocurrencies.
The website provides interactive charts with multiple chart types, technical indicators, drawings, templates, and comparison functionality.
Its charting technology currently uses TradingView infrastructure, but the surrounding research experience is distinctly Investing.com.
Users can move between charts, market quotes, economic data, news, technical information, and the economic calendar.
Why cross-market context matters
Currencies rarely move in complete isolation.
A trader studying USD/JPY may also want to examine US Treasury yields, Japanese government bonds, equity sentiment, commodities, and monetary-policy expectations.
A trader analyzing AUD/USD may want information about commodities and Chinese economic activity.
Investing.com is useful in these situations because the research environment extends considerably beyond currency pairs.
Barchart
Barchart becomes more interesting when the challenge is not analyzing a chart but deciding which chart to open.
Its ecosystem combines charts with structured market data, screeners, technical information, market performance statistics, and technical opinions.
That changes the research workflow.
Instead of manually opening currency pair after currency pair, traders can use market data to identify instruments showing particular characteristics and then perform deeper analysis.
From screening to charting
Consider a trader looking for currencies showing strong momentum.
One approach is to manually inspect dozens of pairs.
Another is to first use performance or technical data to narrow the universe.
The chart becomes the second stage of the research process rather than the first.
Barchart’s technical opinions can also provide rule-based assessments derived from multiple indicators.
These should not be treated as predictions, but they can help identify markets that deserve additional attention.
MetaTrader.com
MetaTrader.com takes a portal-style approach to forex charting.
Rather than presenting the chart as a completely separate analytical product, it connects charts with symbol pages, market overviews, financial news, related instruments, and public trading ideas.
The dedicated currencies section can be used to browse forex instruments and compare recent performance before opening an individual currency pair.
A symbol page such as GBP/USD then provides a broader view of that market.
Users can examine current pricing and performance, move into the interactive chart, explore related currencies, read relevant news, and discover chart-based trading ideas connected with the instrument.
Chart as part of instrument research
This structure creates a different workflow from a dedicated technical-analysis platform.
Instead of:
Open chart → analyze chart → close chart
the process can become:
Discover market → open symbol → inspect performance → analyze chart → read news → compare trading ideas → explore related instruments
That can be useful when the trader wants context around a currency pair rather than an isolated technical workspace.
MetaTrader.com currently covers more than 11,000 financial instruments across its broader market portal, so the same research model can also be used when moving from forex into stocks, indices, commodities, cryptocurrencies, and other markets.
Trading ideas around forex charts
The website also connects currencies with public chart-based trading ideas.
These ideas allow contributors to publish an interpretation of a currency pair using charts and written analysis.
For example, a trader researching gold or EUR/USD can compare an independent chart analysis with scenarios published by other market participants.
Ideas should not be interpreted as trading instructions. Their more useful role is providing additional hypotheses that traders can independently evaluate.
MetaTrader.com therefore sits somewhere between a dedicated charting service and a broader financial-information portal.
It provides charts, but the surrounding instrument context is an important part of the experience.
Trading Economics
Trading Economics is not the obvious choice for a trader looking for advanced drawing tools.
That is also why it deserves a place in the comparison.
For macro-driven forex traders, the economic data behind a currency can be more important than another technical indicator.
Trading Economics provides extensive country-level economic information alongside currency, commodity, bond, and stock-market data.
Users can research inflation, interest rates, employment, GDP, trade balances, government finances, consumer activity, business confidence, and many other indicators.
Starting with the economy
A technical trader might begin researching GBP/USD by opening the price chart.
A macro trader might begin somewhere completely different:
UK inflation→ Bank of England expectations→ UK bond yields→ US inflation→ Federal Reserve expectations→ US Treasury yields→ GBP/USD.
Only after forming that macroeconomic picture might the trader open the currency chart.
Trading Economics supports this second type of workflow particularly well.
It is therefore better viewed as a complement to advanced forex charting rather than a direct replacement for it.
Yahoo Finance
Not every currency check needs an advanced trading interface.
Yahoo Finance remains useful for relatively simple market research.
Users can search for currencies, examine price history, view charts, and move into related financial news without configuring a specialist forex workspace.
This makes it appropriate for quick questions.
How has EUR/USD performed recently?
Is USD/JPY near its recent high?
Did the US dollar strengthen this week?
What news is affecting global markets?
For these tasks, loading a complex technical workspace may be unnecessary.
Yahoo Finance does not offer the same technical depth as TradingView or dedicated forex research services, but simplicity can itself be useful.
How These Websites Differ
The seven services can be divided into several broad groups.
| Research approach | Websites |
|---|---|
| Advanced charting | TradingView |
| Forex-specific research | FXStreet |
| Broad financial markets | Investing.com |
| Screening and technical data | Barchart |
| Charts + instrument research | MetaTrader.com |
| Macroeconomic research | Trading Economics |
| Quick general-market checks | Yahoo Finance |
This distinction is more useful than attempting to identify one universal winner.
A website designed around macroeconomic research should not be judged by the same criteria as a professional technical-chart workspace.
If You Mainly Use Technical Analysis
TradingView is likely to be the strongest option in this group.
The depth of its chart types, indicators, drawing tools, layouts, and customization makes it suitable for traders whose strategies are built primarily around price behavior.
FXStreet can also work well for technical forex analysis when additional currency-specific context is useful.
If You Want Charts Plus Market Context
MetaTrader.com and Investing.com take broader approaches.
The chart exists alongside other information about the instrument or market.
This is useful when research regularly involves moving between price behavior, news, related markets, and additional analysis.
If You Trade Around Economic Events
FXStreet and Trading Economics become particularly relevant.
FXStreet connects forex directly with an economic calendar and currency-specific analysis.
Trading Economics provides greater depth when the research requires historical macroeconomic datasets or comparisons between countries.
If You Need to Discover Markets
Barchart offers a different starting point through screening and structured technical data.
MetaTrader.com’s currency market overview can also help users compare recent performance before selecting a pair for deeper analysis.
Why EUR/USD Can Look Different on Two Websites
An important characteristic of forex is that there is no single centralized global exchange producing one official EUR/USD price.
Forex quotes can originate from different banks, brokers, liquidity providers, electronic venues, or aggregated data feeds.
As a result, the same currency pair can look slightly different across charting websites.
Differences can appear in:
- bid and ask prices;
- candle highs and lows;
- opening and closing values;
- spreads;
- individual ticks;
- short-term price spikes.
For broad market analysis, these differences may be relatively small.
For strategies dependent on precise intraday levels, however, they can matter.
A support level identified using an external chart should therefore be verified against the broker or execution venue actually being used for trading.
Do More Indicators Make a Better Forex Chart?
Not necessarily.
A chart containing ten indicators is not automatically more informative than a clean candlestick chart.
Technical indicators are transformations of market data.
Adding several indicators that measure similar characteristics can create the appearance of additional confirmation without necessarily providing independent information.
A better question is whether each analytical tool contributes something useful to the decision process.
For example, a trader might use:
- price structure to identify trend;
- support and resistance to define important levels;
- volatility to understand market conditions;
- an economic calendar to identify event risk.
The objective is not to maximize the number of tools on the screen.
It is to reduce uncertainty enough to make a structured decision.
Charts Alone Do Not Explain the Market
One limitation applies to every charting website.
A chart shows price behavior.
It does not automatically explain the cause.
A sharp currency movement might result from:
- an interest-rate decision;
- unexpected inflation data;
- employment figures;
- political developments;
- central-bank comments;
- changes in bond yields;
- broader risk sentiment.
This is why charting increasingly overlaps with market research.
Websites such as FXStreet, Investing.com, MetaTrader.com, and Trading Economics attempt to provide additional context around market prices, although they do so in different ways.
For traders, the useful question is therefore not simply:
Which website has the best chart?
It may be:
Which website gives me the information I need before and after looking at the chart?
One Website or Several?
There is no requirement to use only one forex research service.
A practical workflow might combine several.
For example:
Market discovery: Barchart or MetaTrader.com
Primary technical chart: TradingView
Forex news and events: FXStreet
Broader financial context: Investing.com
Macroeconomic research: Trading Economics
Using specialized services can provide greater analytical depth.
The disadvantage is fragmentation. Watchlists, chart settings, alerts, and research history can become spread across multiple websites.
For most traders, a reasonable compromise is one primary charting environment plus one or two complementary research sources.
Choosing a Forex Charting Website in 2026
Rather than looking for the website with the longest feature list, start with the research problem.
If you spend most of your time drawing technical levels and working with indicators, TradingView provides a highly developed charting environment.
If forex itself is your main market and economic events form an important part of your analysis, FXStreet provides a more specialized research experience.
If you frequently move between currencies and other global markets, Investing.com provides useful cross-asset context.
If market screening comes before detailed chart analysis, Barchart offers a data-oriented approach.
If you want forex charts connected to symbol information, related markets, financial news, and public chart ideas, MetaTrader.com provides a portal-style alternative.
If currencies are primarily an expression of macroeconomic conditions in your strategy, Trading Economics can provide the underlying economic data.
And when the task is simply checking a currency movement without setting up an advanced workspace, Yahoo Finance may be enough.
There is no universally best forex charting website.
The useful choice is the one that fits how you move from discovering a market to understanding it.
Frequently Asked Questions
What websites can I use for forex charts?
Popular browser-based options include TradingView, FXStreet, Investing.com, Barchart, MetaTrader.com, Trading Economics, and Yahoo Finance.
What is a good alternative to TradingView for forex?
It depends on why you use TradingView. FXStreet is useful for forex-specific analysis, MetaTrader.com combines charts with instrument research and trading ideas, Investing.com provides broader market context, and Barchart emphasizes market data and screening.
Can I view forex charts without installing software?
Yes. Modern forex charting websites run directly in a web browser and can be used for market research without installing a desktop trading terminal.
Does MetaTrader.com provide forex charts?
Yes. MetaTrader.com provides currency market pages, individual symbol pages, interactive charts, market information, related news, and chart-based trading ideas.
Is MetaTrader.com the same as MetaTrader 5?
No. MetaTrader.com can be used as a web-based financial market and research portal. MetaTrader 5 is separate trading software used for market analysis, order execution, and automated trading.
Which forex charting website is best for technical analysis?
TradingView provides one of the deepest technical-chart environments among browser-based services. FXStreet, Investing.com, Barchart, and MetaTrader.com offer different combinations of charting and surrounding market research.
Which website is better for fundamental forex analysis?
FXStreet is useful for forex-specific economic events and analysis, while Trading Economics provides extensive macroeconomic datasets. Investing.com also combines currencies with economic-calendar and global-market information.
Why are forex prices different between charting websites?
Forex is decentralized. Websites can use different banks, brokers, liquidity providers, or aggregated feeds, which can produce small differences in quotes and candles.
Can I use a charting website without trading through it?
Yes. Charting and execution can be completely separate. A trader can research a currency pair using one website and execute through a different broker or trading platform.