How to Calculate and Mitigate Business Liability Risks
Table Of Contents
Introduction
Every business carries risk. The question is whether that risk is visible on your balance sheet or hiding somewhere you haven't looked yet.
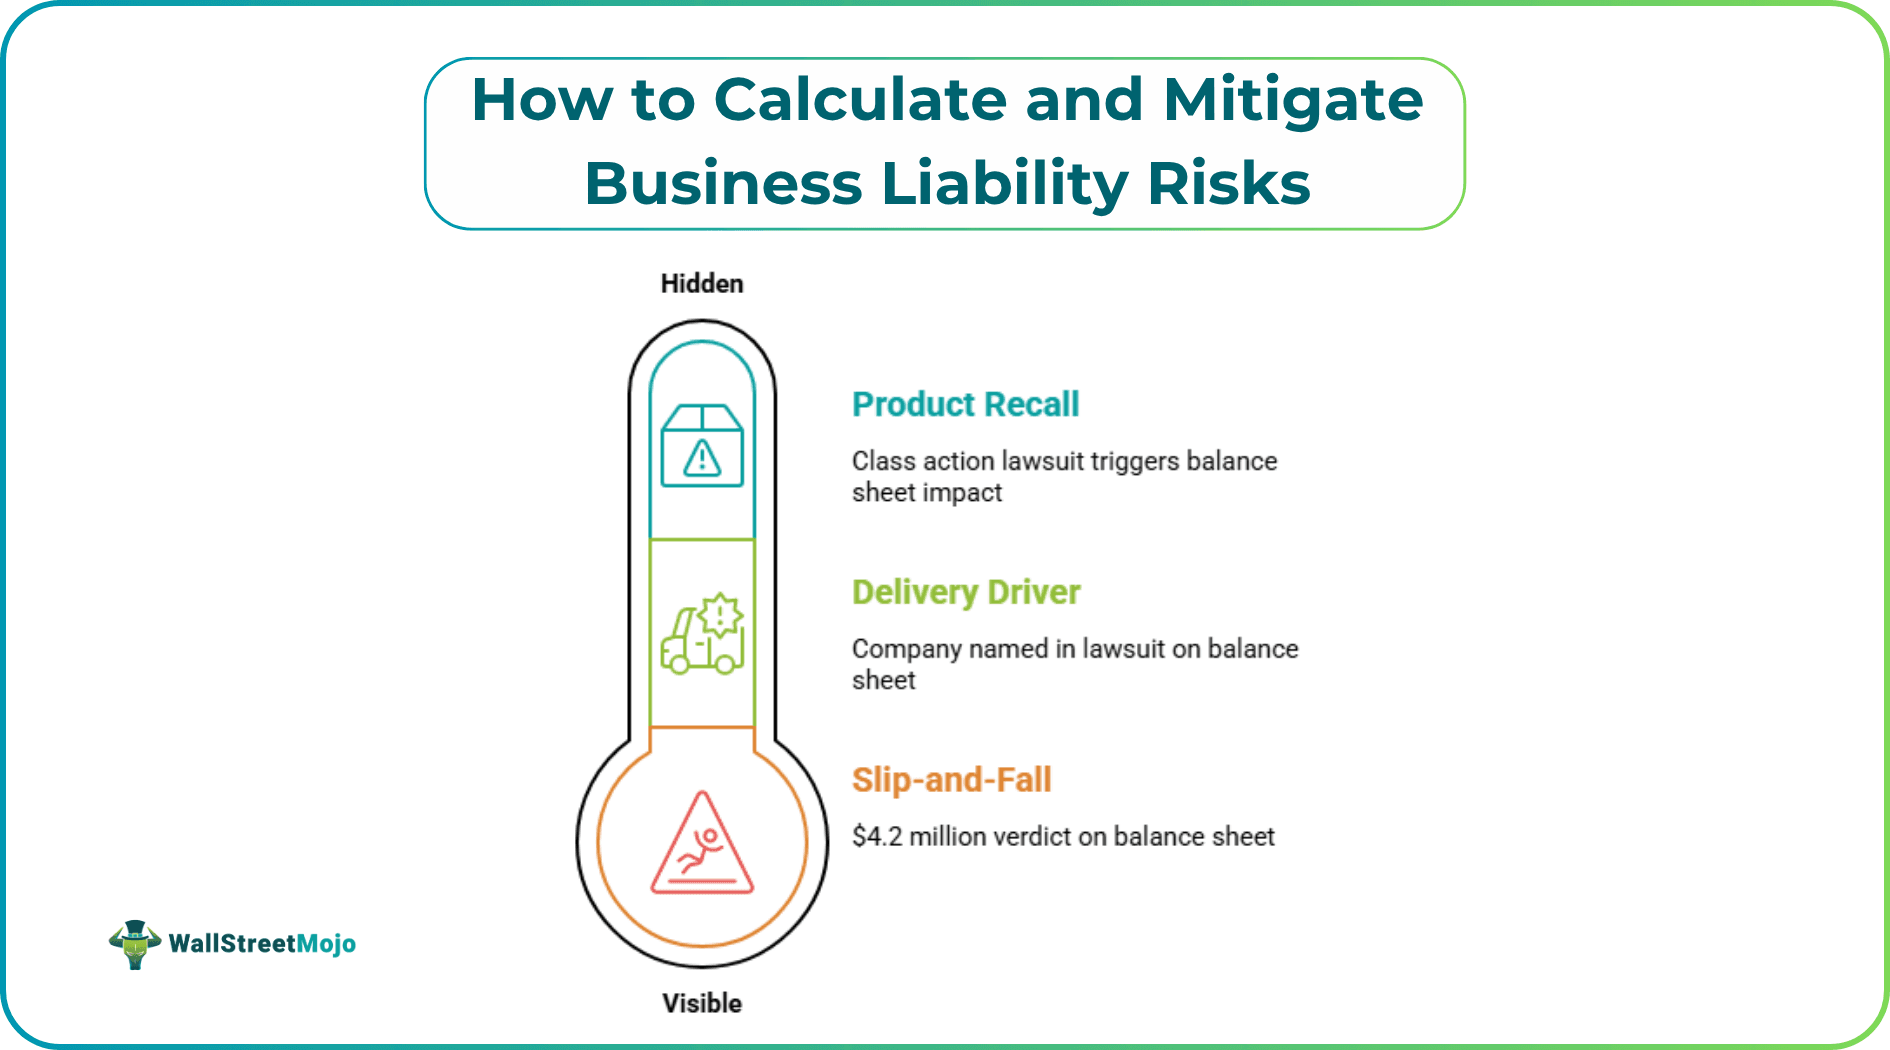
Liability exposure isn't abstract. It's the slip-and-fall at your San Francisco office that turns into a $4.2 million verdict. It's the delivery driver who rear-ends someone on the 405 and names your company in the lawsuit. It's the product recall that triggers a class action before your legal team even finishes their coffee. This article covers how to actually quantify liability risk, which frameworks companies use to stress-test their exposure, and where most finance teams get it wrong. Not legal advice - analytical groundwork for making better business decisions.
Why Liability Is a Finance Problem, Not Just a Legal One
There's a persistent assumption that liability risk lives in the legal department's inbox until it doesn't. By then, the financial damage has usually started.
Personal injury claims alone cost U.S. businesses hundreds of millions of dollars annually in settlements, verdicts, and indirect costs lost productivity, insurance premium spikes, reputational drag. In high-litigation states like California, the exposure is disproportionately concentrated. Companies operating there have learned to factor in regional legal density from the start. Resources like the top personal injury law firms in California help map the litigation landscape understanding local plaintiff-side capacity is genuinely useful when modeling worst-case scenarios for a California-based operation.
The disconnect happens when finance teams treat liability as a binary: either nothing happens, or the insurance pays. Neither assumption is reliable.
Step 1: Categorize Your Exposure
Before you can calculate anything, you need to sort liability into buckets.
Most businesses face some combination of these:
- Premises liability - injuries on company property, slip-and-falls, inadequate security
- Product liability - defective goods, inadequate warnings, design flaws
- Employment liability - wrongful termination, discrimination, wage and hour violations
- Auto/fleet liability - vehicle accidents involving company-operated or employee vehicles during work hours
- Professional liability (E&O) - errors, omissions, or negligent advice in service-based businesses
- Cyber liability - data breaches, ransomware, third-party notification costs
Each category carries different probability profiles and different loss severity distributions. A premises claim in Texas looks nothing like a product liability case in New Jersey. The geography shapes both frequency and cost.
Categorizing isn't just administrative hygiene. It determines which actuarial models apply and which insurance products you actually need.
Step 2: Apply the Expected Loss Formula
The baseline formula for quantifying liability risk is deceptively simple:
Expected Loss = Probability of Incident × Average Severity of Claim
Say you run a mid-size logistics company with 200 drivers. Industry data suggests roughly a 12% annual incident rate for commercial fleets (actual figures vary by region, vehicle type, and driver tenure). Average settlement for a commercial vehicle accident in a major metro: anywhere from $75,000 to $500,000 depending on injury severity and jurisdiction.
Rough calculation: 200 drivers × 12% = 24 expected incidents per year. If even 30% of those generate third-party claims at an average of $120,000 per resolved claim — that's roughly $864,000 in expected annual liability cost.
Now cross that against your insurance coverage, deductibles, and self-insured retention layer. Is there a gap? Usually yes. That gap is what finance should be provisioning for.
A few caveats worth noting:
- Probability estimates should be built from internal claims history, not just industry averages. Your company's actual loss record is more predictive than a benchmark.
- Severity distributions are fat-tailed. The "average" claim is dominated by high-value outliers. Running a scenario with the 95th percentile outcome is not paranoia — it's sound modeling.
Step 3: Stress Test Against Catastrophic Scenarios
Average loss estimates are useful for provisioning. They're useless for understanding existential risk.
McDonald's 1994 hot coffee case - Liebeck v. McDonald's - became a cultural punchline, but the actual damages (reduced on appeal to $480,000) were modest compared to what the case cost in reputational and operational changes. Johnson & Johnson's Tylenol recalls in the 1980s showed something different: a company that moved fast, absorbed massive short-term costs, and survived. The liability itself wasn't fatal. The response either is or isn't.
For stress testing, model at least three scenarios:
- Baseline - expected loss based on historical frequency and average severity
- Elevated - 2× severity assumption, representing mid-range adverse outcomes
- Catastrophic - a single event at the 99th percentile: multi-plaintiff litigation, punitive damages, or a class action
What does your balance sheet look like in Scenario 3? Can your current insurance program actually respond? Does your coverage have the right sublimits, or is there a gap between what you think you're covered for and what the policy actually pays?
Most SMBs running this exercise for the first time discover their coverage is structured around Scenario 1 and partially handles Scenario 2. Scenario 3 lands on the equity.
Step 4: Map the Mitigation Levers
Calculating the risk is the diagnostic. Mitigation is the treatment plan.
The main levers are fairly consistent across industries:
- Insurance architecture. General liability, umbrella policies, and excess layers need to be structured in layers. Umbrella limits that seem large often aren't - $5 million in coverage sounds like a lot until you're facing a $12 million verdict. Review your carrier's defense cost accounting too: some policies erode limits through defense spending, others don't.
- Contractual risk transfer. Indemnification clauses, hold harmless agreements, and vendor insurance requirements shift liability exposure downstream. This works - until the indemnitor doesn't have the assets or coverage to make the transfer meaningful. Financial vetting of your counterparties belongs in contract review, not just legal review.
- Operational controls. Incident rate reduction is the only mitigation that actually shrinks the underlying exposure. Driver safety programs, premises inspection protocols, product quality testing, HR compliance training - these move the frequency variable in the Expected Loss formula. Insurance is a financial hedge; operational controls are the actual risk reduction.
- Claims management. How a company responds to a claim in the first 48 hours affects both the ultimate cost and the probability of litigation. Companies with proactive incident response protocols - early contact with claimants, prompt investigation, clear documentation - consistently see lower average settlement costs than those who default to silence and denial. This is documented across insurer data and independent actuarial research.
- Reserves and self-insurance. Larger organizations often use captive insurance structures or self-insured retention programs to manage high-frequency, low-severity claims in-house. The cost efficiency can be real but it requires sufficient capital cushion and a disciplined claims function. For smaller businesses, this is usually not the right path
Step 5: Build a Liability Risk Register
None of this is sustainable as a one-time exercise. It has to live somewhere.
A liability risk register is the operational document that makes this continuous. It typically includes:
- Identified risk categories and subcategories
- Current probability and severity estimates for each
- Insurance coverage mapping (what's covered, what's excluded, what's retained)
- Mitigation controls in place and their status
- Open claims and reserves
- Trigger points for review (material change in operations, new jurisdictions, claims activity above threshold)
This isn't an exotic risk management tool. It's a spreadsheet with discipline attached to it. The value is in the review cadence - quarterly for most businesses, monthly for high-exposure operations.
What Finance Teams Consistently Underestimate
A few patterns that show up repeatedly:
- Indirect costs. A $200,000 settlement is the number that goes on the claims ledger. The actual financial impact - management time, increased insurance premiums, potential regulatory scrutiny, brand damage - can be 3 to 5 times the direct loss. Almost no one models this explicitly.
- Jurisdictional concentration. A company with 60% of its operations in one high-litigation state is not carrying diversified liability exposure. Geographic concentration creates tail risk that isn't visible in a simple expected loss calculation.
- The "it's covered" assumption. Insurance policies have exclusions, sublimits, conditions precedent to coverage, and cooperation clauses. A claim that looks covered can be denied - or partially covered - based on factors that nobody reviewed at renewal time. Coverage audits with a qualified broker are not optional for any business above $10 million in revenue.
- Judgment proofing on paper. Corporate structure can limit liability exposure for specific entities, but courts regularly pierce the corporate veil when they find inadequate capitalization, commingling of funds, or failure to observe corporate formalities. Structural protection requires actual structural discipline.
The Bottom Line
Liability risk doesn't become a finance problem when someone files a lawsuit. It already was one - the lawsuit just made it visible.
Businesses that manage this well treat expected liability cost like any other line item: something to be estimated, provisioned for, actively reduced, and periodically stress-tested against realistic adverse scenarios. The Expected Loss formula is a starting point. The stress test tells you what you're actually exposed to. The risk register keeps it from becoming a once-every-crisis conversation.
Run the numbers before the incident does it for you.