Table of Contents
Expected Tail Loss Definition
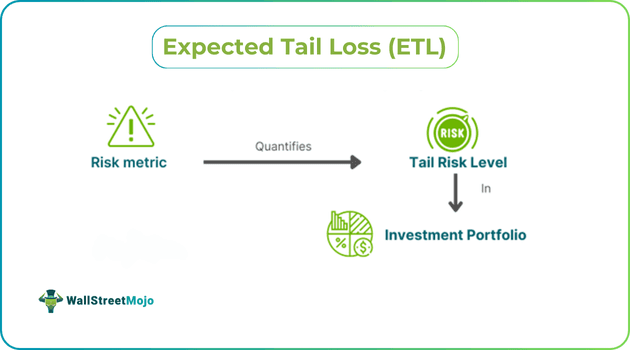
Expected Tail Loss (ETL) is a risk assessment metric that quantifies the degree of tail risk in an investment portfolio. It measures the impact of rare events with severe consequences on financial and economic markets, providing an accurate method of risk calculation.

It is calculated using the Value at Risk (VaR) cut-off point and tail losses of distribution. It helps investors set realistic estimations of possible losses on their investments. In addition, it leads to the creation of more robust portfolios. It plays an important role in the effective risk management of portfolios and security investments.
Key Takeaways
- Expected Tail Loss (ETL) is a risk metric used to measure the extent of tail risk assessment in a portfolio.
- It aims at evaluating the potential impact of infrequent and effective events on economic and financial markets.
- It has been the most accurate approach for determining risk by providing a detailed understanding of the extreme consequences related to such events.
- ETL represents the average loss that surpasses a chosen percentile. On the other hand, expected shortfall denotes the conditional average loss occurring beyond that quantile.
Expected Tail Loss Explained
Expected Tail Loss (ETL) is an extension of VaR, which represents the minimum portfolio loss at a specified confidence level. ETL helps to define the degree of losses suffered on average when the level of losses has exceeded the cut-off value. It can be taken as an extreme version of VaR, which provides metrics of the mean loss within the worst tail situations. It is calculated by considering the tail or end of the loss distribution, emphasizing the extremely negative outcomes.
Moreover, it offers a more holistic and complete view of possible losses than VaR. As a result, it has become an important and valuable tool for risk management. Financial institutions use ETL to gain an in-depth understanding of potential extreme events, enhancing their risk management practices. Additionally, it provides detailed conservative estimates of potential losses. This leads to more robust and informed decision-making by these institutions.
ETL is widely used in the financial industry for various purposes. It plays a significant role in regulatory compliance and risk management in the finance sector. Institutions use it to communicate and evaluate the potential effect of severe events on portfolios to investors and stakeholders. ETL execution has added a deeper and more comprehensive understanding of risk in the financial field. Its contribution is seen in the recognition of risk and mitigation in the aftermath of the recession in 2008. Moreover, the expected tail loss formula calculates the mean of losses exceeding a particular percentile. It provides in-depth metrics for risk exposure.
Examples
Let us use a few examples to understand the topic.
Example #1
Let us imagine that Alex, a hedge fund manager, oversees his customer’s diverse portfolio of investments. He wants to know the risk of this portfolio. He used VaR and found that his portfolio has:
VaR = 95% confidence level of million
It means his portfolio could lose more than one million dollars per day with a 5 percent chance. Hence, he decides to know the average amount of loss he could suffer on days with a 5% chance. Therefore, he uses ETL and finds that:
ETL = 1.5 million dollars.
As a result, he estimates that on the worst 5 percent days when losses exceed 1 million, his loss amounts to 1.5 million dollars. As a result, he abandons the investment decisions.
Example #2
In a remarkable study, researchers have deeply analyzed the Moroccan stock market, especially the Moroccan All Shares Index (MASI). They focused on considering investment risks by applying Expected Tail Loss (ETL). The ETL approach offered a better view of possible downturns than the VaR approach. As per the study, MASI showed huge volatility owing to its high-density trading on heavy-weight stocks. Moreover, upon measuring using VaR and ETL, the top five stocks contributed to more than 80% of the overall loss to the market.
The research also underscored an ongoing downward pattern in the stock markets from 2009 to June 2016. It focused on the risks contained in investing in the MASI portfolio. Both ETL and VaR calculations point to the high probability of losses overshadowing the mixed yields from different market segments.
Interestingly, these findings are validated by the reports of the Casablanca Stock Exchange, which show a lack of liquidity and trading volume. Hence, it suggests increasing disinterest and limited investment avenues amongst investors to have clarity on volatility and risks related to Moroccan financial markets. As a result, investors have been able to make more informed decisions about investing in stocks.
Expected Tail Loss Vs. Expected Shortfall
Both ETL and Expected Shortfall (ES) are used as risk metrics for quantifying potential losses inside portfolio investments. However, they have certain differences, as shown in the table below:
| Expected Tail Loss | Expected Shortfall |
|---|---|
| Mean loss exceeds a chosen percentile. | Represents the conditional average loss given beyond that quantile |
| ETL focuses on the tail of the loss distribution | Complete loss distribution outside of the quantile |
| Depicts the tendency of extreme losses | Metrics for severity in losses exceeding a certain threshold. |
| Used in risk management, stress testing, and portfolio optimization. | Used in capital adequacy, risk management, and regulatory compliance. |
| Simpler and easier in calculation while less sensitive to outliers. | Captures the extremity of losses and is a highly understandable risk measure. |
| Does not provide much information about loss severity beyond quantile. | Tends to be more ambiguous in calculating and more sensitive to quantile choice. |
