Tail Risk Meaning
Tail Risk is defined as the risk of an event that has a very low probability and is calculated as three times the standard deviation from the average normal distribution return. Standard deviation measures the volatility of an instrument concerning the return on investment from its average return.
Tail risk not just refers to the movement of an instrument but may also refer to any investment or business activity whose growth or downfall can be monitored. Investors look at the risk to assess and invest in different hedging positions to mitigate the loss that could arise from possible such a risk. Strategies adopted by investors to curb the losses arising and can add value during a crisis
- Tail risk is an improbable occurrence risk computed as three times the standard deviation from the average normal distribution return.
- Although the possibility of a tail risk-taking impact is low, its magnitude will be significant if it occurs, influencing connected portfolios. It can be found at either extreme of a distribution curve. It has far-reaching consequences for financial markets and the economy.
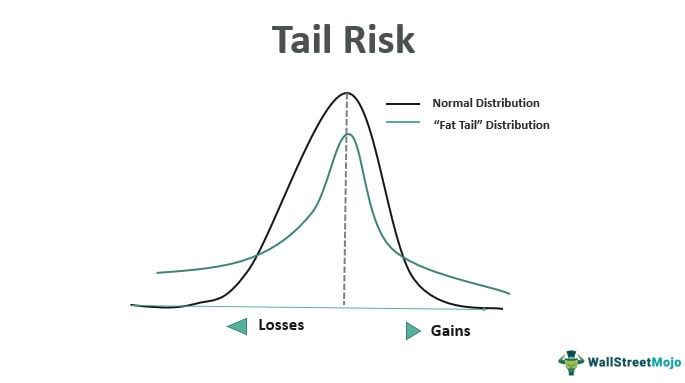
- The most prominent downside is shown at the left end of the curve. Tail risk illustrates an occurrence that may occur if the market makes an unexpected move.
Tail Risk Explained
Tail risk event refers to nay type of risk that is very rare and extreme, Thus, they have extremely low possibility of taking place but if they take place, they have a very huge impact. Some examples of such cases are natural disasters or market crashes or any geopolitical event.
This risk is the possibility of a loss that might occur as per a prediction of probability distribution prediction due to a rare event.
A short-term movement of three times the standard deviation represents a tail risk. The risk can be on both sides of the curve; right indicates profits whereas left indicates losses. Since it is a risk, the focus is more on the left side of the curve. Tail risk event encourages hedging strategies since hedging reduces potential loss.
Investors and businesses can study the risk to understand the risk involved in an investment. This kind of risk is very important to them because they lead to huge losses if they occur, resulting in market downturn, liquidity shortage, panic, etc. It also has positive impact for those who can use the upside risk because such rare events can cause huge gain too.
The possibility of a such a risk-taking effect is minimal; however, if it happens, the magnitude is high, which would hit related portfolios. It may occur at either end of a distribution curve. It can cause considerable implications for the financial markets and the economy.
Tip
Important Points
- The left end of the curve indicates the extreme downside.
- Tail risk depicts an event that may occur if the market makes an unfavorable move.
Examples
The following are examples of the same.
Example #1
Dow Jones Industrial Average or Dow Index shows the health of 30 public companies based out in the United States of America. The companies in the Dow Index are also a part of the S&P 500 Index. The index performed well from its inception and went above the 24k mark in December 2017. Since then, it has had an upward movement, and the market has attracted more and more investors.
In Jan 2018, the index hit the 26k mark, and investors were expecting the market to boom further, but due to economic slowdown and trade wars, the whole of the US equity market plunged, resulting in the fall of the Dow Index as well. The index went through several ups and downs and reached back to the 24k mark in Oct 2018, which was the lowest mark it hit in over a year. This was a 10% move and had a concerning effect on the market.
The market went on to lose another 6% in Dec 2018 and affect volatility across the market. This was a massive fall for the market. In Dec 2018, the index plunged to 21k over a 19% downward move from the high in that particular year. This was a significant fall for the index and impacted the days to come on the market.

Source – Finance.yahoo.com
The tail risk in the case of the Dow Index was when the market started taking a downward move in Oct 2018. The fall at that period was 24k, which was just a behavioral movement; however, the conditions got worse when the index started going below the 24k mark.
The example of the Dow Index best explains the this risk event and how it can affect the market as a whole.
Example #2
The case of Lehman Brothers is well known to the world due to its notorious effect on the banking industry. Lehman was considered Too Big to Fail owing to its large market capital and revered client base across the globe. Due to lenient policies and incorrect reporting, the business could not hold up to the changing market. The same was the case with Bear Stearns.
The aftermath of the Lehman collapse was so severe that it impacted all other industries, including steel, construction, and hospitality, to name a few. The risk in Lehman’s case had impacted not just the banking industry. Still, it trickled down to other industries and resulted in significant setbacks and economic losses that affected the GDPs of many countries. The economic impact was so grave that it led to the global recession. The incident resulted in an economic slowdown and many unemployed people due to the layoffs across all industries.
There were numerous reports on how the business was not being run right and how it would result in a significant collapse. However, none of the reports were given weight until the problem had reached a mammoth stage when it was unstoppable.
Before Lehman filed for bankruptcy, the business activities it was heading into had to be monitored, and correct reporting of all its economic conditions had to be made, which led to a significant mishap.
Managing tail risk enables investors and businesses to gauge the risk involved in the investment they make. If the same had been analyzed for the business activities it was heading into, the business could have been led in a better way to avert the great collapse of 2007-08, which shook the world.
Strategies
Some common strategies managing tail risk that can be used in the financial market are given below:
- Hedging – This involves purchasing options or any other instrument that can take advantage of market downturn and offset the potential loss during such extreme events.
- Portfolio based on risk – Here the portfolio is based on risk contribution rather than the market capitalization. This balances the risk exposure and mitigates the losses to a large extent.
- Diversification – It involves spreading the investments across various asset classes. This helps in reducing the impact of the risk from a single event but not eliminate it completely.
- Tail risk premium – This involves selling insurance-like options to collect premium. This premium income offsets any loss and offers tail risk protection during unforeseen or sudden events.
Such strategies may not always work and protect the investment from losses during extreme conditions due to their complex nature. They require a through and careful management, monitoring and analysis.
Advantages
Let us look at some of the advantages of this type of risk that investors can use.
- It allows investors to gauge the risk involved in the investment and enhances decision making in hedging strategies.
- It encourages hedging, which results in increased inflow of funds into the market.
- Creates awareness about any possible negative movement which can disrupt the market.
Disadvantages
Even though the situation has many advantages, there are some important disadvantages also that investors should be aware of.
- Investors may be encouraged to invest overly in tail risk hedging strategies.
- There is a high possibility for such a risk event not to occur even once.
- It creates a sense of fear among investors, resulting in a negative outlook.
How To Hedge?
Hedging is the process of implementing tail risk hedging strategies to protect the investment against huge losses. A few commonly used approaches to hedging against the risk are as follows:
- Trading in futures contracts – This method involves using techniques of following trend patterns with the aim of using market trends to book profits during such events. They provide both diversification and also offset losses.
- Use of VIX options – VIX (Volatility Index) measures the expected market volatility. Investors can buy VIX call options because such options increase in value during the market crisis. During high volatility, they ris e considerably.
- Mutual funds of ETFs – Certain mutual funds (MF) and exchange-traded funds (ETFs) are designed to offer tail risk protection. They are a convenient way to protect investors without going for individual positions requiring expertise and experience.
- Put options – This is a very common method and the holder gets the right to sell the asset at a predetermined price within a particular time period. When such risk occurs, the put option value increase, leading to profits.
However, such methods are costly and involves payment of premium, management fee, etc and does not guarantee total protection. Therefore such methods should be used after proper cost benefit analysis.
Frequently Asked Questions (FAQs)
What is tail risk coverage?
If your company’s insurance policy is issued on a claims-made basis, tail coverage is included. It protects your company from claims made after your insurance coverage has expired. It is also known as an extended reporting period.
How do you hedge tail risk?
Buying equity put options is a common technique to hedge tail risk. These allow the contract holder to sell at a specific price, thus putting a floor under possible losses if stock prices fall drastically.
What is left tail risk?
“Tail risk” or “left-tail risk” refers to an investment’s most severe negative performance periods. Most notably, these occurrences exceed expectations for the frequency, length, and amount of losses an investor has prepared for or for which the investor is reimbursed.
Recommended Articles
This has been a guide to Tail Risk and its meaning. We explain strategies with example, how to hedge, advantages and disadvantages. You can learn more about financing from the following articles –