What is Gini Coefficient?
The Gini coefficient, also known as the Gini index, is the statistical measure used to measure the income distribution among the country’s population, i.e., it helps measure the income inequality of the country’s population. One of the Gini index’s limitations is that it requires that no one has negative net wealth.
It is a value between 0 and 1. A higher number on the Gini coefficient calculator indicates a greater degree of income inequality. A value of 1 indicates the highest degree of income inequality, where a single individual earns the country’s entire income. A value of 0 indicates that all individuals have the same income. Thus, a value of 0 indicates perfect income equality.
Key Takeaways
- The Gini coefficient is also known as the Gini index.
- It is the statistical measure used to determine the income distribution among the country’s population.
- One of the Gini index’s limitations is that it requires that no one has negative net wealth.
- One could also use it to compare income inequality across different population sectors.
Gini Coefficient Explained
The Gini coefficient is a metric used to analyze wealth or income distribution. Therefore, one can use it to compare income inequality across different population sectors. For instance, one can compare the Gini index of urban areas in a country with rural areas. Similarly, one can compare one country’s Gini index to another’s. One can also use it to find income inequality over some time. For instance, the Gini coefficient in India in the year 2000 can compare with the coefficient of 2019.
Gini coefficient countries aim to keep the value lesser than 0.2 as this indicates a negligible level of income inequality among the citizens within the economy. According to a study in 2023, the country with the highest value in this regard is South Africa with a staggering value of 63.
One can use this coefficient along with GDP numbers. If the Gini index is increasing along with GDP, then there may not be an improvement on the poverty front for most of the population. Based on this coefficient, welfare measures can be designed for the population to reduce income inequality.
Formula
Let us understand the formula for us to find the value through the Gini coefficient calculator from the explanation below.
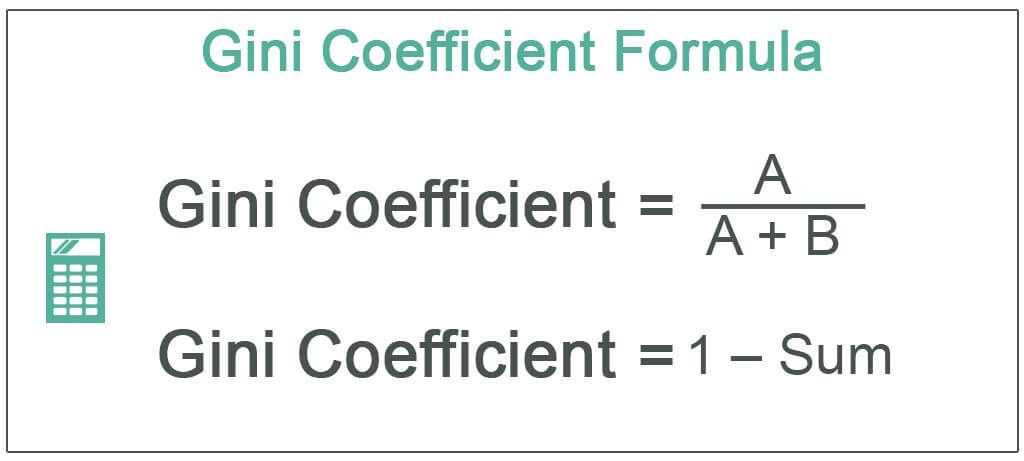
Gini Coefficient = A / A + B
If A=0, the Lorenz curve is the line of equality. When A=0, the Gini index is 0. The Gini coefficient is large in case A is very large and B is small. It indicates there is huge income/wealth inequality.
How To Calculate?
Gini coefficient countries take the following steps to find the value that indicates the inequality among their citizens’ incomes is as follows:
Organize the data into a table with the category head mentioned below.

It is important to note that all the rows must organize from the poorest to the richest. For instance, if it states that the bottom 10% of the population earns 3% income, write 0.03 in the ‘Fraction of Income’ column. Next, write 0.10 in the ‘Fraction of Population’ column. Similarly, fill these two columns with other percentages given.Fill ‘% of Population that is richer’ column by adding all terms in ‘Fraction of Population’ below that row.

For instance, we fill the first row in the ‘% of Population that is richer’ column. Then, we will add 0.50 and 0.40, the rows in ‘Fraction of population’ below it. Hence, we get 0.90.Calculate the Score for each of the rows. The formula for Score is:
Score = Fraction of Income * (Fraction of Population + 2 * % of Population that is richer).
For instance, score for the 1st row is 0.03*(0.10+2*0.90) = 0.057Next, add all the terms in the ‘Score’ column. Let us call it ‘Sum.’
Calculate the Gini coefficient using the formula: = 1 – Sum


Examples
Complicated concepts such as this are understood better with the help of a few practical snippets. Let us take the help of a few examples and use the Gini coefficient calculator to understand the concept in depth.
Example #1
The Gini coefficient of 2 countries based on citizens’ income is as under.

- Interpret the trend of income inequality in the two countries
- Which country has higher income inequality in 2015?
Solution:
a) The Gini coefficient of Country A has shown a rising trend from 0.40 in 2010 to 0.57 in 2015. Hence, income inequality in Country A has risen in these years. On the other hand, the coefficient of Country B has fallen from 0.38 in 2010 to 0.29 in 2015. Therefore, income inequality in Country B has declined over these years.
b) The coefficient of Country A (0.57) is more than that of Country B (0.29). Hence, Country A had higher income inequality in 2015.
Example #2
In a particular country, the lowest 10% of the earners make 2% of all wages. The next 40% of earners make 13% of wages. The following 40% of earners make up 45% of all wages. Moreover, the highest 10% of all earners make 40% of all wages. Calculate the Gini coefficient of the country.
Solution:
Use the following data for the calculation.
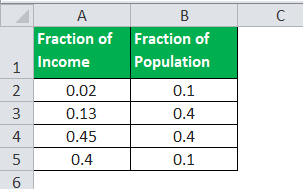
Let us compile the above information in table format. But, first, the information has to be compiled by organizing the rows from the poorest to the richest.
Sum of Scores = 0.038+0.182+0.27+0.04 =0.53
The coefficient will be –
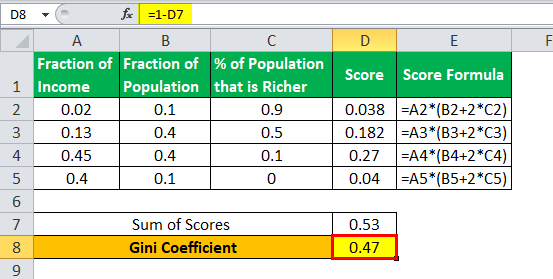
Coefficient = 1 – 0.53 = 0.47
Example #3
The administration of a village is concerned about income inequality in the village. It wants to introduce some developmental schemes to reduce income inequality. For this purpose, it requires data relating to income inequality. The administration ordered a research study about income levels in his village. Here are some findings from the research study: 6 people earn ₹10 each, 3 people earn ₹20 each, and 1 person earns ₹80. Calculate the Gini coefficient relating to the income inequality in the village.
Solution:
Use the following data for the calculation.

We will have to tabulate the given information. For this purpose, we will have to find a fraction of the population earning what proportion of income.
Sum of Scores = 0.42 + 0.15 + 0.04 = 0.61

Coefficient = 1 – 0.61 =0.39
Coefficient is 0.39
Example With Excel Template
To calculate the value for a Gini coefficient country with ease, let us discuss how to calculate the formula with excel through the discussion below.
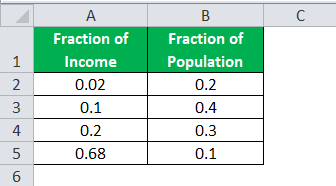
In a country, there are huge skyscrapers along with humongous slums. The Chief Economist of the country believes that there is huge income inequality. He finds the following data: The lowest 20% of the earners make 2% of all income. The next 40% make 10% of all income. The following 30% make up 20% of all income. Finally, the richest 10% make up 68% of all income. Calculate the Gini coefficient to give the chief Economist a statistical measure of income inequality.
Solution:
Step 1: Write the ‘Fraction of Income’ and ‘Fraction of Population’ data in tabular format in Excel.
Step 2: Fill the % of Population that is richer’ column by adding all terms in ‘Fraction of Population’ below that row. For instance, in the first row under ‘% of Population that is richer,’ write the formula = B3+B4+B5. Then, drag the formula to subsequent rows.

Step 3: In the score column, write =A2*(B2+2*C2). Then, drag the formula to subsequent rows.

Step 4: Calculate the sum of the scores. In cell D6, write =SUM(D2: D5)
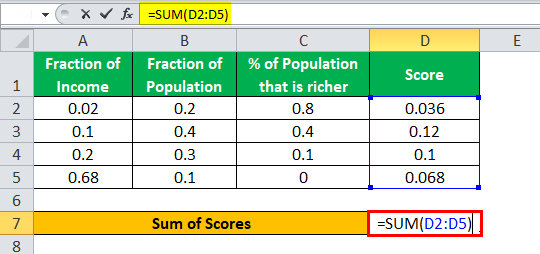
Step 5: Write =1-D6 in cell B9. Thus, 0.676 is the Gini coefficient.

Measures
Despite the fact that one solution might not work for all countries as every country has their own demography and level of advancement, some measures need to be taken to narrow the gap down. As decision-makers of Gini coefficient countries that want to reduce the inequality of income among their citizens, the following steps can be inculcated.
- Shifting of taxes from labor to capital-related taxes to encourage hiring more workers
- Increasing Child Tax Credit (CTC)
- Creating a wealth tax
- Providing unemployment benefits
- Imposing Value-Added Tax (VAT)
- Redistribution of land and other capital
- Imposing taxes on inherited property and estate.
Frequently Asked Questions (FAQs)
What does a low Gini coefficient mean?
A Gini coefficient of zero indicates there is equal income distribution. Whereas a number near one shows greater inequality. Thus, the lower the Gini coefficient, the more similar the society.
What are the Lorenz curve and Gini coefficient?
The Lorenz curve is the focal point in determining the Gini coefficient, a mathematical portrayal of inequality levels. Still, since Lorenz curves are mathematical calculations depending on fitting a continuous curve to incomplete and discontinuous data, they may be imperfect evaluations of true inequality.
What is the U.S.e US Gini coefficient?
In 2021, as per the Gini coefficient, household income distribution in the United States was 0.49. In addition, in 1990, this figure was at 0.43, which shows an increase in income inequality in the U.S. over the last 30 years.
What does a negative Gini coefficient mean?
The Gini coefficient can range from 0, complete equality, to 1 (absolute inequality). Often, it is expressed as a percentage ranging between 0 and 100. However, if negative values are possible, the Gini coefficient can be more than 1.
Recommended Articles
This article is a guide to what is Gini Coefficient. Here we explain its formula, how to calculate, examples, excel template, and measures to reduce inequality. You can learn more about financial analysis from the following articles: –