Table of Contents
What Is High Probability Trading?
High probability trading refers to the strategies and methods that traders adopt in order to enter into trades that have good return potential against the risk involved. Such strategies require skill and experience, along with a clear understanding of the financial market.
In order to take a profitable trade in a sea of opportunities, there are many steps and tests that the trader should be aware of. The decisions also involve a lot of subjectivity and bias, but there should be enough control, confidence, and conviction regarding the final trade decision.
Key Takeaways
- High probability trading involves using highly profitable and planned strategies that lead to a successful trade in the financial market.
- The trader should have proper clarity and understanding regarding the asset or financial instrument that they are trading in so that they have enough confidence and conviction in their approach.
- The process involves steps that require the study of various fundamental and technical tools that help in identifying trades with good returns.
- It also means keeping the risk to a minimum level and making objective decisions based on the current trends in the market.
How Does High Probability Trading Work?
High probability trading means entering into trades that have good return prospects but, at the same time, have strategies that will manage risk to a large extent. The plans and strategies used should be such that the probability of profits will be higher. This requires an excellent level of experience and skill, which they are able to use to identify opportunities, buy and sell points, and stop loss levels that will restrict the loss amount.
Various steps should be used in high probability trading setups as indicators for profitable trades that align with the ideas and market expectations. Only then will the profitability from the trade be more than the risk involved. Trading styles also play an essential role along with risk appetite. The probability level of good trades for a trader whose risk-taking capacity is higher will not be the same as for a trader whose risk-taking capacity is lower.
It is also necessary to have a good understanding of the political and economic circumstances of the country because this affects financial markets in a big way. Smart traders usually avoid entering the market just before any significant political or economic event because such events typically influence the market sentiments, sometimes making it perform against predicted results.
Above all, in high probability trading setups, it is crucial to have control over one’s tendency to speculate or unthinkingly take chances to earn returns from the market without proper analysis or study. One should not become excessively desirous of profits because this leads to a fall in the probability of good trades.
How To Find High Probability Trades?
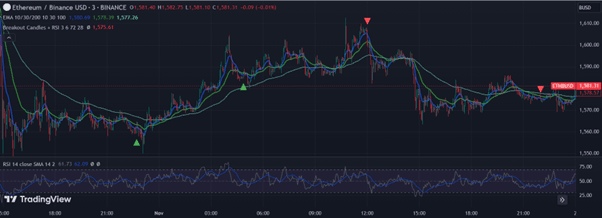
It is possible to find excellent and profitable trades that are low-risk high probability trading strategy by analyzing charts from TradingView, as given below. In this chart, multiple indicators are visible. However, a trade decision with a high probability of profit would be an entry made at the points marked by small green arrows because at those levels, the prices are at their lowest points after, and the RSI shows a trend reversal due to oversold positions. The points marked with red arrows show downward reversals, marking them as exit points.
Strategies For High Probability Trade Setups
Various strategies of high probability trading indicators will lead to a trade that can turn out to be a success. They are given below.
- It is common for a trader to look for a proper trend, either upwards or downwards, to understand the market sentiments. It is possible to identify it using trend lines, support and resistance levels, and candlestick patterns that give an idea of the current trend and the possible change in direction or reversals. Accordingly, the trader can change their trade strategies to earn maximum profits.
- Every trade needs a trigger to start or end. It means there is a specific entry point or exit point, and it is essential to identify them. Missing the entry point means an excellent opportunity is lost, and missing the exit point will lead to losses. Indicators like support and resistance levels using pivot points or Fibonacci, indicators like MACD (Moving Average Convergence Divergence), etc, help in identifying high probability trading patterns.
- Stop-loss levels are significant for risk management. While buying, stop loss is placed just below the start of the uptrend, and for sell trades, it may be placed just above the turning towards a down move. The RSI (relative strength index) indicates the overbought and oversold points, which are helpful in selecting the stop loss.
- Traders can decide on their profit targets based on some indicators and measure the gaps between the upper and lower levels of the same. Usually, trend channels are drawn during trend reversals, and price targets are selected at the top of the channel for buying during an uptrend.
- The reward-to-risk ratio is another important factor in determining a profitable trade. There is no ideal value for the ratio, but the higher the value, the better. This means that the reward should be as much as possible, more than the risk. Traders should avoid trades where the risk is more than the reward.
Examples
It is possible to understand the concept of high probability trading patterns with the help of some suitable examples, as given below.
Example #1
Ned is a short-term investor who wants to buy JL Ltd, a cement company's stock. Currently, the company has bagged some outstanding construction projects in different countries, creating positive market sentiments. Ned has drawn a channel in the daily and weekly price chart, which shows consolidation, but he is waiting for a positive breakout. Very soon, he notices a big green candle at the top of the channel in the daily chart, along with good volume. But he waits for a confirmation so as to get a high probability trading in this case. His conviction is supported by another bullish engulfing candle in the daily as well as weekly chart, giving him the entry point. He exits with a 25% profit within a week, which he had planned for.
Example #2
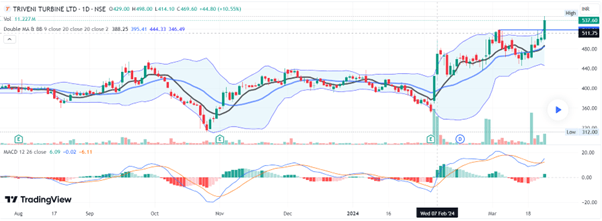
In the chart taken from TradingView, a number of technical indicators were used, including MACD, Bollinger Band (BB), simple moving averages, volume, etc. All of them combined will give a wholesome idea about the entry and exit levels for trade, resulting in high probability trading. On February 7, 2024, a bullish breakout with a green candle from Bollinger Band is visible, along with good volume, a bullish crossover in MACD (MACD crossing the signal line from below), and the price candles moving above both the moving average lines. Here, the trader can enter the market on the breakout date with a stop loss at the level of lower BB and exit the market at the point where the MACD crosses the signal line from above, which is also the point at which the prices fall below the moving average lines.
Importance
The concept plays a vital role in different aspects of trading.
- This concept will involve the use of multiple trading strategies and indicators that ensure a good trade and provide confirmation up to a very high level.
- Traders are compelled to use proper stop losses to ensure maximum risk management to avoid loss.
- This concept promotes responsibility in the trading process in the financial market because traders will avoid speculation.
- It is possible to earn maximum profit from a trade using high probability trading indicators, which is a source of good return through proper analysis and study.
- Traders also take an interest and keep track of the latest news and developments in the political and economic scenario, which is essential for a good trade.
