Interest Coverage Ratio Meaning
An interest coverage ratio (ICR) is the tool that helps assess how easily an entity could pay the interests against the outstanding dues it has. The results make it easier for lenders and creditors to check how reliable the finance seekers would be if trusted with the significant loan plus interest amount.
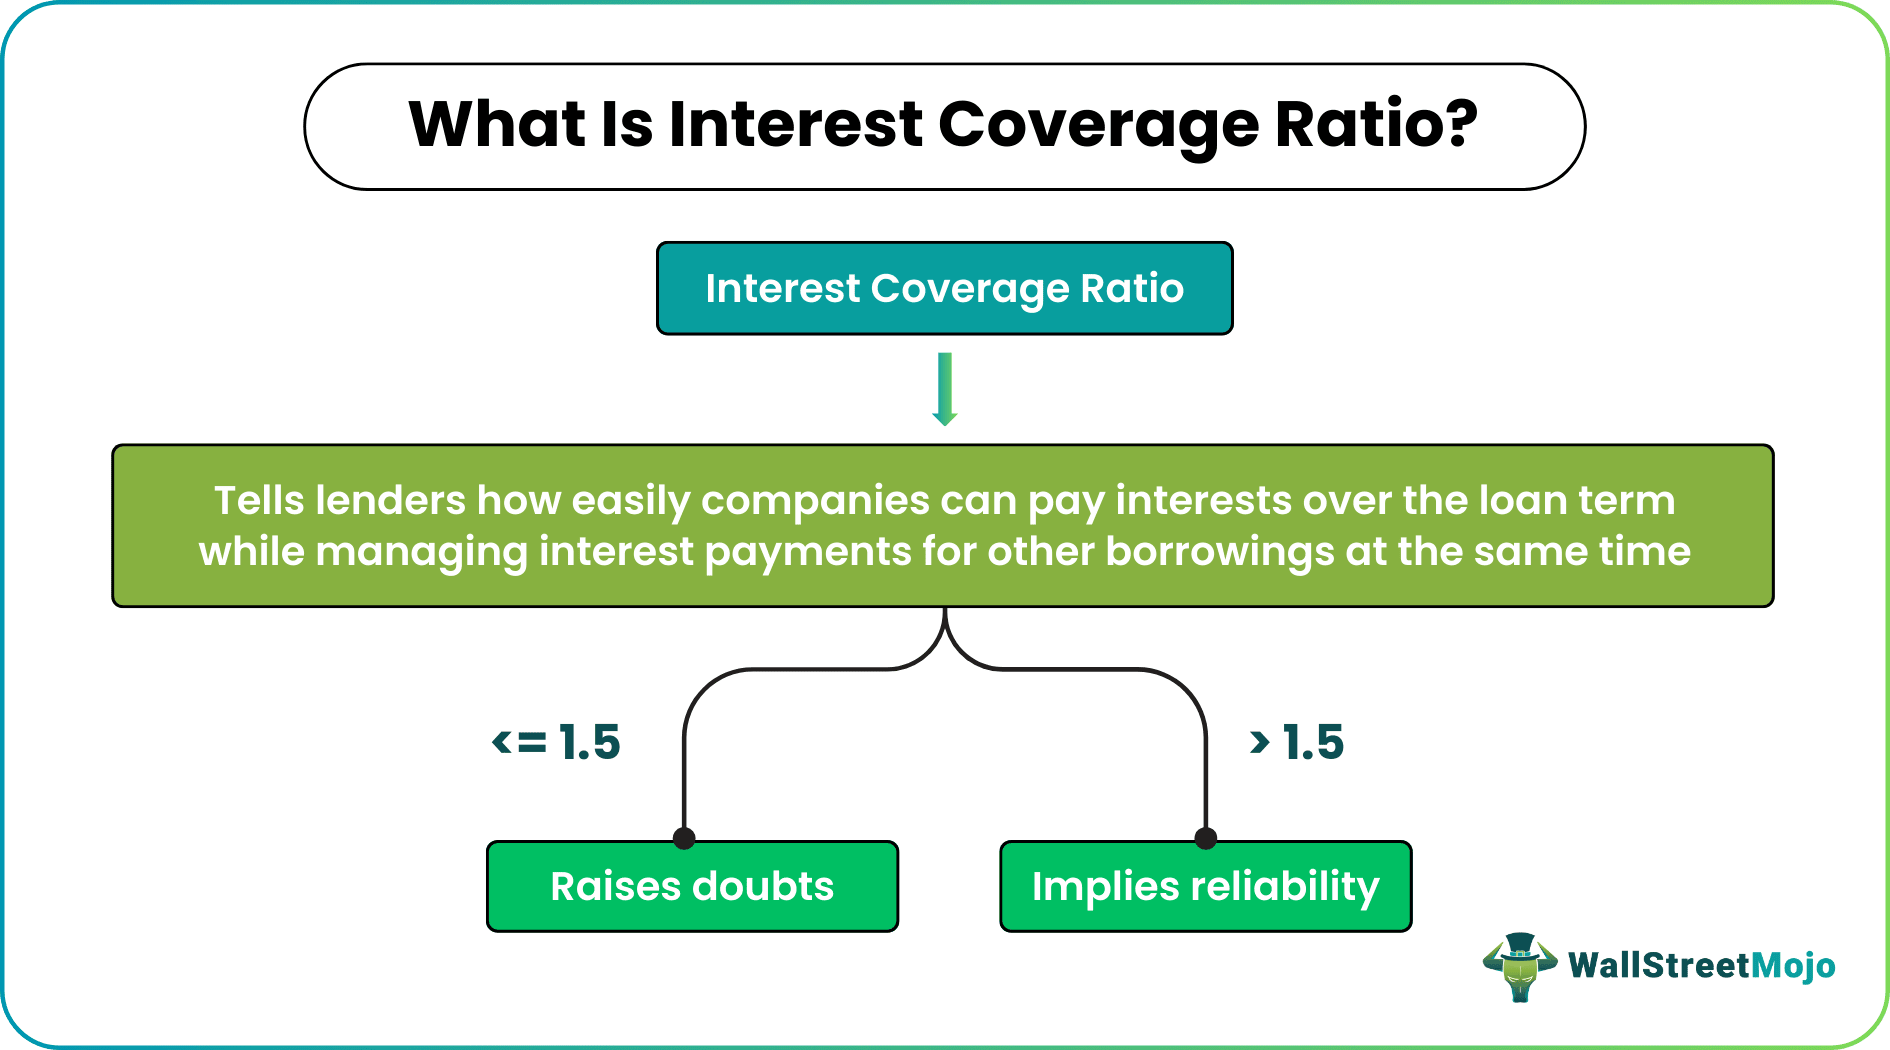
Also referred to as the times interest earned ratio, it helps people to figure out the risk associated with the lent amount. The higher the ICR, the lower the risk. Thus, the investors and lenders prefer lending money to entities with a higher ratio as they know the latter is capable of paying interests easily over a loan term.
- An interest coverage ratio is a metric that helps lenders determine if the borrowing party can easily pay the interests on time.
- It helps them understand whether the companies borrowing the money would be able to manage interest payments for multiple borrowings at a time.
- The variation in the ICR results could be seen with respect to EBIAT and EBIDAT, whichever is used for the calculation.
- The ICR is also a good indicator for other stakeholders, such as investors, creditors, employees, etc., to make timely decisions.
Interest Coverage Ratio Explained
The interest coverage ratio relieves lenders and creditors, assuring them of getting the interest payments on time. Most companies have money borrowed from different sources simultaneously. Thus, the lending institutions need an assurance of getting back their payment, especially their interests, at regular intervals. The ICR helps them know how likely the borrowers are to miss the interest payments.
When lenders calculate the interest coverage ratio, they can decide whether they should approve or disapprove a loan amount for the applying entity. The lower the ratio, the higher the chances of defaults and bankruptcies.
ICR helps to determine how easily a company can pay interest on its outstanding debt/borrowings. It is classified as:
- Debt Ratio – It gives a general idea about the financial structure and the financial risk a company has.
- Solvency Ratio – It helps to understand if the organization is solvent and whether there are any near threats of bankruptcy.
Explanation of Interest Coverage Ratio in Video

Interest Coverage Ratio Formula
The interest coverage ratio formula is:
ICR= Earnings Before Interest and Taxes (EBIT) / Interest Expense
Here,
- EBIT is the operating profit of the company
- Interest expense is the total interest payable on multiple borrowings of the company
Variance
As EBIT serves as an important factor in the expression above, the interest coverage ratio results might have an expected variance with respect to the forms of EBIT used for calculation. EBIT amount can be of two forms – Earnings Before Interest, Taxes, Depreciation, and Amortization (EBITDA) and Earnings Before Interest After Taxes (EBIAT).
When EBITDA replaces EBIT in the above interest coverage ratio formula, it excludes depreciation and amortization, which makes the numerator greater than what it would have been in the case of EBIT. As there is no change in the interest expenses, which is the denominator, the ICR will be higher in this case.
On the contrary, when EBIAT replaces EBIT, the numerator becomes lower than the EBIT after tax expense deductions. Therefore, lenders prefer EBIAT as it offers a better and clearer business picture, as the ICR is much more accurate in this case.
Interpretation
The interest coverage ratio interpretation suggests – the higher the ICR, the lower the chances of defaults. Thus, lenders look for a significant ratio to ensure they do not get ditched during the loan term. When this ratio is high, it indicates the sound financial health of the company, which ensures lenders of easy interest payments throughout the loan tenure. On the contrary, if the ICR is low, it marks a not-so-healthy financial state of the companies. Hence, entities with lower ICR are less trusted for loans.
While lenders and creditors should not expect an ICR above 2, some groups do not feel secure until loan seekers have an ICR of 3. However, the ratio of 1.5 or less signifies the poor health of the company, which would mean doubts on its ability to manage even short-term interest liabilities.
Example
Let us consider the following interest coverage ratio example to see how the concept works:
Company X applied for a loan. As it had multiple borrowings to manage simultaneously, the lenders found the ICR first to decide whether to approve or disapprove the loan amount. The lenders found that the EBIT is $15,000, and the interest expense is $1700, $1500, and $2000. The company calculates the ICR using the following formula:
ICR = Earnings Before Interest and Taxes (EBIT) / Interest Expense
ICR = 15000/5200 = 2.88
The calculation relieved the lenders as they were sure the borrower would pay interest on time.
Importance
The interest coverage ratio helps lenders and borrowers in one way or another. Through this ratio, the lenders learn about the financial health of the finance seeker and assess their ability to pay interest on time. So, the higher the ratio, the easier it is for the borrowers to manage their interest payments against multiple borrowings.

When the ICR is high, it assures lenders of timely interest payments without any risk of bankruptcies. For the companies, who are borrowers, the ICR is useful to learn about their financial stability. They can still work and improve their efficiency and financial condition if they obtain a lower ratio.
The ICR helps in trend analysis, whereby a company compares its financial statements to figure out the trend. Doing this helps them understand the past patterns and accordingly predict future trends. As a result, companies get an opportunity to work and improve their future performance.
Frequently Asked Questions (FAQs)
What is an interest coverage ratio?
The interest coverage ratio is the ratio used to determine how many times a company can pay its interest with the current earnings before interest and taxes of the company and is helpful in determining the company’s liquidity position by calculating how easily the company can pay interest on its outstanding debt.
What is a good interest coverage ratio?
An ICR greater than 1.5 is considered an ideal ratio. Many lenders look for companies with an ICR of 3, which is not a lenient figure to expect. However, they are confined to allowing loans to only those entities with an ICR of more than 2 to 3.
How to improve the interest coverage ratio?
The ICR can be increased in two ways. One is by increasing the earnings before interest and tax, i.e., EBIT, which could be achieved when revenue increases. Another one is by decreasing finance costs or reducing the interest expense.
Recommended Articles
This is a guide to what is Interest Coverage Ratio & its meaning. Here we explain how it is interpreted with its formula, examples and calculation. You can learn more from the following articles –