List of Microeconomics Formula
Microeconomics is the study of economics where the performance of firms and individuals towards delivering sustainable results by employing limited resources are assessed, analyzed, and studied. It also explores how one individual or firm interacts with another individual or firm. Microeconomics’ broad goal is to determine and research market prices for the goods and services offered and how well the limited resources are utilized to deliver the goods and services.
The following microeconomics formulas that help in understanding the position of the economy are listed below:
| Sr No | Formula Name | Formula |
|---|---|---|
| 1 | Total Revenue | Price x Quantity in Demand |
| 2 | Marginal Revenue | Changes in Total Revenues Earned / Changes in the Quantity Traded |
| 3 | Average Revenue | Total Income or Revenue earned by the Business / Total Quantity |
| 4 | Total Costs | Total costs incurred on a fixed basis + Total costs that vary with the quantity produced |
| 5 | Marginal Costs | Changes in the Level of Total Costs / Changes in the level of Quantity Produced |
| 6 | Average Cost | Total Costs / Total Quantity |
| 7 | Average Fixed | Total Fixed Costs / Total Quantity |
| 8 | Average Variables | Total Variable Costs / Total Quantity |
| 9 | Profit Earned | Total Revenue – Total Costs |
| 10 | Profit Earned | Marginal Revenue – Marginal Costs |
Key Takeaways
- Microeconomics is the study of how individuals and firms make decisions about using limited resources to produce goods and services.
- It examines how firms and individuals interact with each other in the market.
- The main goal of microeconomics is to analyze the market prices of goods and services and determine how efficiently resources are being utilized to produce them.
- If a firm’s marginal revenue exceeds its marginal costs, it should increase production to improve profitability.
- If a firm’s marginal revenue falls below its marginal costs, it should decrease production to reduce costs.
#1 – Total Revenue
It is the situation wherein demand is assessed in terms of price elasticity. It is expressed as the product of the overall price and the quantity in demand. If the prices are high, it will result in inelastic demand, resulting in more revenue. Conversely, demand is elastic when the prices are high, and there are low volumes.
Mathematically, it can be illustrated as follows:
#2 – Marginal Revenue
The marginal revenue is expressed as the ratio of total revenue changes concerning the modifications in the quantity retailed. Marginal revenue is the additional revenue earned for the extra quantity sold. Mathematically, it can be illustrated as follows:
#3 – Average Revenue
Revenues can be described as the receipts a firm received once it sold finished goods to its consumers. The average revenue is the total revenue ratio concerning the overall quantity sold. Mathematically, it can be illustrated as follows:
#4 – Total Costs
Under Economics, the total cost is determined as the sum of fixed costs and variable costs. The variable costs are the costs that tend to vary with the level of goods sold by the organization. Fixed costs are the type of costs that endure being the same throughout the levels of quantity sold by the business.
Mathematically, it can be illustrated as follows:
#5 – Marginal Costs
The marginal cost formula is defined as the appreciation or deterioration in the overall costs that the business incurs. At the same time, it prepares finished goods ready for sale. Graphically, marginal costs are plotted as a U-shaped curve wherein the costs appreciate initially, and as the production rises, the prices deteriorate. Mathematically, it can be illustrated as follows:
#6 -Average Total Cost
The average total cost is the total costs incurred by the business involved in manufacturing and production to the quantity of items produced by the company. In such a relationship, determine the total costs and total quantity to arrive at the average total costs. Mathematically, it can be illustrated as follows:
#7 – Average Fixed Costs
The average fixed cost is the total fixed costs incurred by the business involved in manufacturing and production to the quantity of items produced by the company. In such a relationship, determine the total fixed costs and total quantity to arrive at the average total fixed costs. Mathematically, it can be illustrated as follows:
#8 – Average Variable Costs
The average variable cost is the total variable costs incurred by the company involved in manufacturing and production to the quantity of items produced by the business. In such a relationship, determine the total variable costs and total quantity to arrive at the average total variable costs. Mathematically, it can be illustrated as follows:
#9 -Profit Made by the Firm
In microeconomics, profit could be computed using several relationships. Firstly, it can be calculated as the difference between total revenues and costs. It can be calculated as the difference in marginal revenue and marginal costs. Whenever the profits are lesser than average variable costs, the business can no longer sustain itself, and it has to be shut down. Mathematically, it can be illustrated as follows:
It can additionally be illustrated as follows: –
When marginal revenue exceeds marginal costs, the organization or firm should produce more items to enhance its profitability. Similarly, when marginal revenue deteriorates below marginal costs, the organization or firm should create fewer items to lower costs.
Examples
Let us see some simple to advanced examples of the microeconomics formula to understand it better.
Example #1
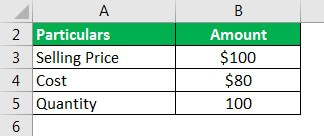
Let us take the example of a small business. It sells its finished products at $100 per unit. It normally generates 100 units a year. Each unit incurs the cost of $80 for developing the finished products. Help the management determine the profits earned by the small business.
Solution
Use the below-given data:
Calculation of Total Revenue:
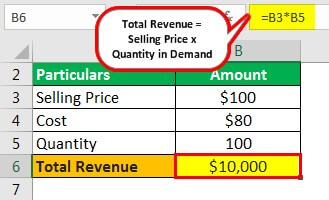
- =$100*100
- Total Revenue = $10,000
Calculation of Total Costs:
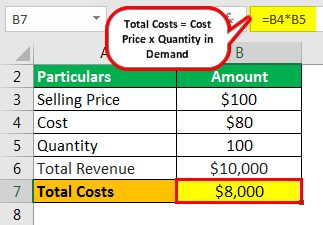
- =$80*100
- Total Costs = $8,000
Calculation of Profit Earned:
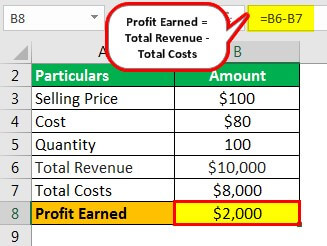
- =$10,000 – $8,000
- Profit Earned = $2,000
Hence, the business earned a profit of $2,000 on producing and selling 100 units.
Example #2
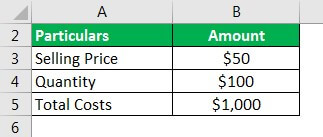
Let us take the example of Knowledge Process Solutions. The business focuses on developing good content for its clients’ maintaining websites. The cost of software annually amounts to $1,000 per year. The company charges its clients $50 per article submitted and accepted. Annually business supplies around 100 articles to its clients. Help the management determine the profit earned on developing and supplying services.
Solution
Use the below-given data:
Calculation of Total Revenue:
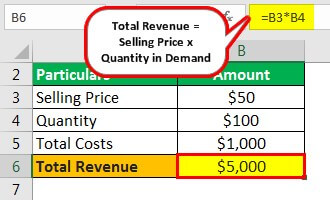
- =$50*100
- Total Revenue = $5000
Calculation of Profit Earned:
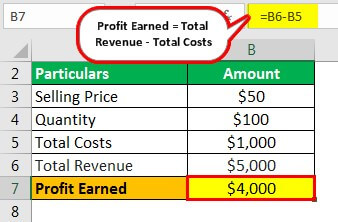
- =$5,000 – $1,000
- Profit Earned = $4,000
Hence, the business earned a profit of $4,000 on producing and selling 100 articles by bearing an annual cost of $1,000.
Example #3
Let us take the example of the company Uber. The company is a popular entity that offers cab aggregator services to daily riders and commuters. The business has developed a dynamic mechanism that studies the demand for cabs with the supply of the cabs with riders.
They also study price levels on which interactions occur between the riders and the drivers of a cab. For example, it learned that the consumer’s demand was relatively inelastic when fares of the rides doubled two times. The system further analyzed the instances when the rider accepted an Uber booking and rejected the booking. It broadly studied the factors relating to time, price, demand, and supply.
Frequently Asked Questions (FAQs)
What is an intermediate microeconomics formula sheet?
An intermediate microeconomics formula sheet is a document that lists the key formulas and equations used in intermediate microeconomics courses. Students can use it as a reference tool to help them solve problems and understand the concepts covered in the course.
What is the marginal utility microeconomics formula?
The marginal utility formula calculates the additional satisfaction or usefulness a consumer derives from consuming an additional unit of a good or service. It is calculated as the total utility change divided by the quantity consumed change. The formula is MU = ΔTU/ΔQ, where MU is the marginal utility, ΔTU is the change in total utility, and ΔQ is the change in quantity consumed.
What is the marginal physical product microeconomics formula?
The marginal physical product formula is used to calculate the additional output or production that results from adding one more unit of labor or capital to a production process. The formula is MPP = ΔQ/ΔL, where MPP is the marginal physical product, ΔQ is the change in total output, and ΔL is the change in the quantity of labor or capital input.
Recommended Articles
This article is a guide to the Microeconomics Formula. We discussed the microeconomics calculations, examples, and a downloadable Excel template. You can learn more from the following articles: –