Table of Contents
What Is Swing High/Low?
Swing high/low are candlestick indicators used in technical analysis that give traders an idea about the current market trend and future price movement possibilities. This facilitates trade decisions when combined with other widely used technical indicators.
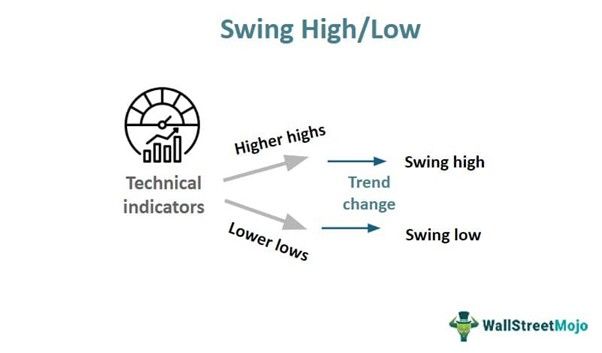
Swing means the prices move in a specific direction in the market. Highs are formed with two consecutive higher highs after a high is already made, whereas the swing low is just the opposite. It is easy to understand and identify within the charts. It is an excellent process to capture trends and use them as profitable trading opportunities.
Key Takeaways
- Swing high/low are candlestick indicators used for technical analysis, where the market prices make highs and lows in a specific pattern.
- Highs are formed with two consecutive higher highs after a high, and lows are formed with two consecutive lower lows after a low.
- They are trend indicators, with the swing high indicating an uptrend and the swing low indicating a downtrend.
- They are widely used in the financial market in any time frame and asset and help traders take advantage of price volatility to make profits.
Swing High/Low Explained
Swing high/low is a technical indicator that shows the price trends in the market, which traders successfully use to identify profitable trading opportunities. The prices of financial assets keep changing depending on a number of conditions. This indicator reveals the market scenario and future trends through analysis of the candlesticks within the chart.
This concept of swing high swing low trading strategy is applicable in any market or asset class, where traders can use this information to design strategies to decide how to approach the market, keeping in mind the price patterns.
It is possible to identify the patterns within the chart quickly. A swing high occurs when there are at least two higher highs after a high appears. Similarly, a swing low occurs when two lower lows follow an already-formed low within the chart.
However, like any other technical indicator, these swing high swing low trading patterns should be combined with other reliable and widely used ones so as to have better understanding and clarity.
How To Identify?
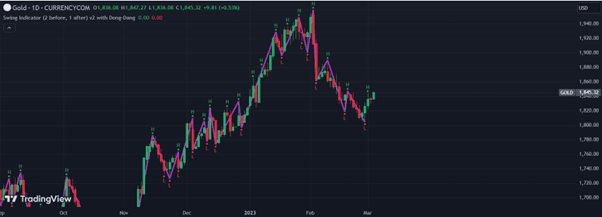
The swing high swing low trading strategy can be explained better using a chart from TradingView, as given below.
In the chart below, the highs and lows are clearly marked. It is visible that the strategy works best in a trending market because there should be a rise and fall in market prices, creating swings.
The higher highs are marked with H, which denotes the swing highs and indicates the uptrend is to continue within the market for the subsequent few trading sessions. Traders may use this to take a long position or buy a financial asset because prices will go up in the future.
The swing lows are marked in S within the chart. Areas where there are lower lows indicate a fall in prices or a downtrend, and areas where there are higher lows, along with higher highs, indicate an uptrend. Therefore, by looking at the chart, it is possible to understand that the location and movement of the peaks and troughs create the swings and help traders visualize price movement and plan swing high swing low trading.
How To Trade?
Trading using this indicator involves the following steps.
- The first step is to plot the swing highs and lows within the chart to ease understanding of the market trend.
- Typically, after a series of swing lows, when prices make a bottom formation, there is a chance for the trend to change. Therefore, after this, higher highs will usually be formed, indicating an uptrend.
- Traders should employ strategies to enter the market at the point where the resistance level is broken. They should take a long position with a stop loss at the point where the price hits the lowest level before turning upwards.
- The swing highs and lows find support and resistance after combining them with other multiple indicators, like the moving averages or the trend lines.
- In case of swing lows, if the price action breaks the support level, then that can be the entry point for a short position, and the stop loss should be at the top of the first low that is formed.
- Apart from the above, making trading strategies also involves the study of fundamentals and comparing them with the price actions taking place in the market.
Examples
It is possible to understand the concept of swing high low indicator with the help of some suitable examples as given below:
Example #1
Max is a long-term investor who uses a combination of technical indicators to analyze an asset and then take a trade. He has been following the stock of JC Paints, which was in a consolidation zone for six months and trading below the support level. However, due to a sudden boom in the real estate sector, the stock started showing an uptrend with higher highs. These swings finally made a breakout from the resistance, and Max took a long position and bought a few stocks at the breakout level.
Example #2
The price movement of Coal India showed a swing high breakout after five years, suggesting a strong bullishness in the stock during the coming trading sessions. This is the highest price level that it touched during the last five years, and the stock struggled to move beyond this resistance level. But finally, it crossed it and went beyond it, showing strength in the uptrend. However, further confirmation from other indicators will make the conviction stronger.
Benefits
Here are some benefits of the swing high low indicator:
- It is a widely used technical indicator that helps traders capture the price movements and make trading strategies based on them.
- They are easy to identify and interpret within the chart.
- They can be used for any time frame and any asset class.
- It also indicates the support and resistance levels based on which traders can decide the entry and exit points.
- It is possible to decide on the stop loss levels and also the target profits that one can expect to earn from the market.
- This indicator works very well in a trending market where prices can move in a particular direction.
Limitations
The concept of swing high swing low candlestick also has certain limitations, as follows:
- It cannot be used as a standalone indicator but instead combined with other trend-following indicators for better confirmation.
- Traders need the skill and experience to understand and interpret the results correctly. Simply identifying them within the chart is not enough.
- Sometimes, it gives false signals. The swing high may be visible in the chart, but MACD and RSI may give the opposite signal, showing divergence. Such scenarios may lead to reversals that are not indicated in the price chart.
- Swing high swing low candlestick is often subjective, and different traders may interpret them differently.
- They also do not react to any sudden price change immediately. Therefore, they are considered lagging indicators.
