Part of our Trading Strategies guide
What Is Price Action?
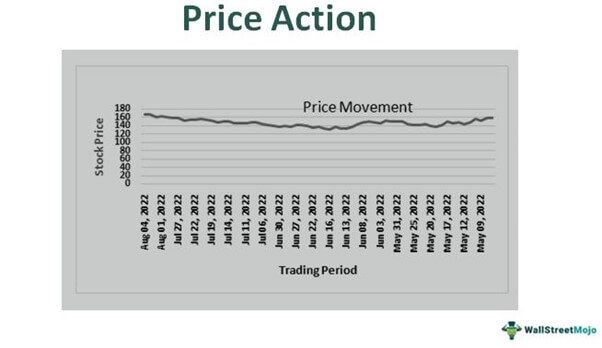
Price action refers to a financial instrument’s price movements plotted over a certain duration. It lays the foundation for the technical analysis of assets, such as stocks and commodities. Many traders use this concept to make crucial decisions on key price levels, trends, and risk management.

Analysts calculate important technical analysis tools like moving average using this concept. Different price patterns help assess trading opportunities. Inside bar patterns and pin bar patterns are two examples. Price action traders ignore the fundamental aspects influencing market fluctuations. Instead, they believe that the security’s price movements are the only reliable source of information.
- Price action is the upward and downward movement of an asset’s price plotted on a price chart. In other words, it is the action of price.
- Individuals can understand when to use what strategy by identifying the candlestick patterns. Examples of such patterns are pin bar, inside bar, fakey, etc.
- This concept works in the same way for both stock markets and foreign exchange markets. One can measure a currency’s price movements using a price chart.
- Price action traders do not consider security or market-related news, data, etc. They primarily focus on the security’s price history.
Price Action Explained
Price action is the increase and decrease of a financial security’s price over a certain period. One can observe such price movements in a highly liquid and volatile market. Traders often use different chart compositions like candlestick patterns to understand this concept because such patterns indicate the price movement clearly by showing open, close, high, and low values. A few candlestick patterns traders use to understand the concept are the engulfing pattern, harami cross, and three white soldiers.
As noted above, individuals primarily trading based on price do not consider the fundamental factors as the support and resistance levels indicate consolidation and breakout. Typically, price action traders primarily consider the price movements of the past 3-6 months while slightly focusing on the price movements before that period.
Besides the price and duration, these traders consider the security’s trading volume. They do not utilize the various technical analysis indicators to predict the price. Moreover, they do not consider any market-related news while making decisions.
This form of trading is also known as naked trading, clean chart trading, and raw or natural trading, owing to its simple approach. Traders believe is that the asset’s price reflects all factors impacting the market.
How To Read?
Let us look at the chart below to develop a comprehensive understanding of this concept.
As one can observe, the Apple stock chart above shows the price movement of the security over a certain period. When analyzing the stock’s price action, considering a couple of factors is crucial. The first one is the price’s direction, and the second one is the trading volume’s direction.
From May 2020 to Septemeber 2020, the overall direction of Apple’s stock price was upward and the volume was also steady. It demonstrated strong conviction within the market since people were buying the stock even when the price was rising. That said, there was a significant drop in price in September 2020. The slump was also accompanied by a drop in trading volume. This meant that the price action might not have been convincing enough for market participants as they were not choosing to buy the stock at the price levels during that time. One can visit the online platform of TradingView to see similar charts and enhance their knowledge concerning this concept.
Price Action Patterns
Price action candlestick patterns serve as key signals or triggers for traders, helping them predict future price movements.
Let us take a look at some popular patterns that can give signs as to what a security’s price might do next.
#1 – Pin Bar Pattern
A pin bar pattern refers to a candle with a long tail or wick. It represents the rejection of price and a sharp reversal. The wick shows the price range that the market rejected. This pattern indicates that the security’s price might move in the opposite direction of the wick. Based on this pattern, traders can decide whether to take a long or short position. This price action trading strategy can be extremely effective in a range-bound and trending market.
#2 – Inside Bar Pattern
This is a 2-bar pattern where the outer or bigger bar is called the mother bar. The smaller bar falls entirely within the mother bar’s high and low range. One can find an inside bar pattern when there’s consolidation in a market. That said, it can signal a turning point or a reversal in the market.
#3 – Fakey Pattern
One can observe this price action candlestick pattern if an inside bar candlestick breaks out momentarily before reversing and closing back within the mother bar’s high and low range. In other words, this pattern appears when the price breaks one away from an inside bar but then returns to the opposite direction, triggering the price movement in that direction.
#4 – Three Candle Reversal Pattern
This consists of three candles in a specific sequence — a bearish (red) candle, a candle with a lower high and a higher low, and a bullish (green) candle. The third candle must have a higher low, and it should close above the second candle’s high.
This pattern signals a reversal. It has the chance of being more accurate than a 2-bar candle as there are three bars.
#5 – Head and Shoulders Pattern
This pattern resembles the shape of a head and shoulders; the security’s price surges, falls, increases even more, drops again, and rises to a lower high before a moderate drop. Many traders choose this price action trading strategy as identifying an entry point and setting a stop loss are straightforward tasks in this case. Typically, the entry point is right at the end of the first shoulder, while the stop loss is at the end of the second shoulder.
Examples
Let us look at a few price action examples to understand the concept better.
Example #1
Suppose John, a trader, is observing the price chart of ABC stock. He identifies a bullish pin bar (the long wick points downward) at the end of a downtrend. Hoping it is a sign of a reversal, he buys 100 shares of ABC stock at $10 per share. After John placed the buy order, the stock’s price surged as an uptrend materialized. He sold the stock at $12 per share and made a profit of $200.
Example #2
The stock price of AMTD Digital, a Hong Kong-based fintech company, has surged more than 21,000% post listing on the stock exchange in July 2022. The reason behind this wild price action is not yet clear. The company has also been unable to identify the reasons behind this incredible surge in stock price. Many are comparing this to 2021’s meme stock frenzy.
Price Action in Forex
→ Explore all 31 Foreign Exchange articles
This concept is the same for the stock and foreign exchange markets. The fundamental principles of demand and supply apply to these markets.
Traders can measure the price fluctuations over a certain duration using volume readings and price charts.
For professional-grade stock and crypto charts, we recommend TradingView – one of the most trusted platforms among traders.
Disclosure: This article contains affiliate links. If you sign up through these links, we may earn a small commission at no extra cost to you.
Frequently Asked Questions (FAQs)
How to learn price action trading?
One can start this form of trading by following these steps:
#1 – Understand the concept
#2 – Learn how demand and supply work
#3 – Know how to determine market bias
#4 – Understand when to enter the market
#5 – Learn how to place stop-loss and take-profit orders
#6 – Learn about the concept of expectancy
#7 – Practice trading
Is price action the best strategy?
In reality, none of the trading strategies, including this one, can be right every time. This strategy suits individuals who wish to earn quick profits, not long-term investors. Therefore, one must identify their financial goals and investment time horizon before selecting a strategy.
Does price action trading work?
Similar to other strategies, this strategy is not accurate every time. Many believe that the market follows a random pattern. Hence, it is impossible to formulate and implement a strategy that can be accurate every time.
How to read price action and volume?
When asset prices surge with high volume, it is a bullish signal. On the other hand, if the asset prices drop along with a large volume, it signals that many people are offloading their holdings. In other words, it is a bearish signal.
Recommended Articles
This has been a guide to price action and its meaning. We explain the patterns of price action candlestick, trading strategy, and examples. You may learn more from the following articles –