Part of our Trading Strategies guide
Swing Trading Meaning
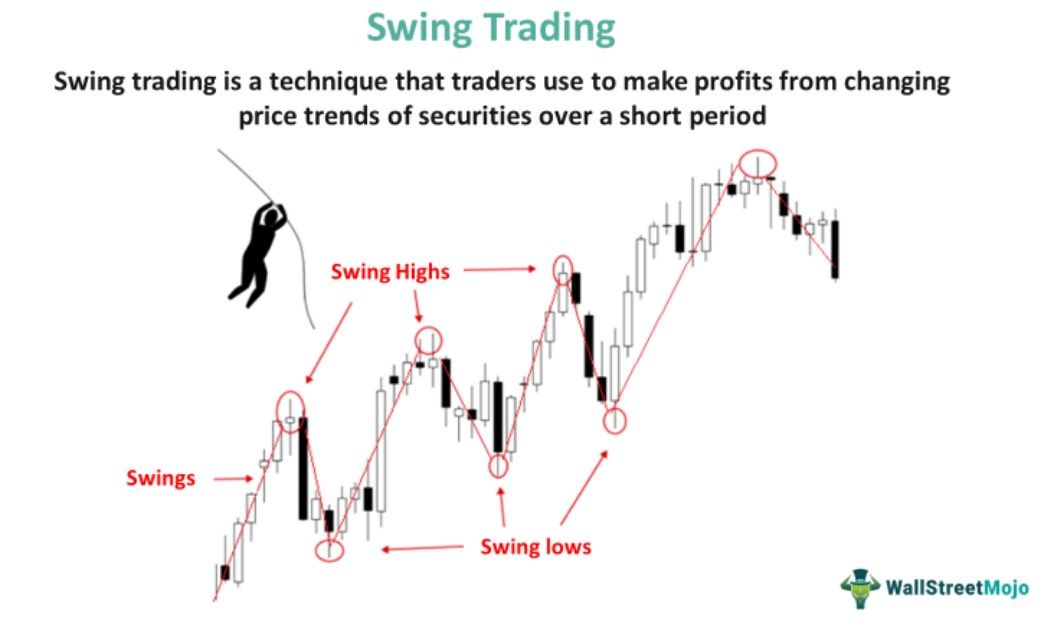
Swing trading (ST) is a stock trading strategy that traders use to profit from short-term price movements of securities. It involves buying or selling securities in a span of a few days or weeks and making significant gains in the short run from an up or downswing or change in the market. Traders usually use technical analysis to identify price swings and trading opportunities.

Swing trading is used to profit from the market trend of securities. Swing traders mostly use temporary price movements to make small profits that cumulate over a long time to yield large gains. However, traders run the risk of overnight price fluctuation of securities and the inability to sell them. As a result, swing trading is subject to market volatility and has higher fees.
- Swing trading is a technique traders use to make profits from changing price trends of securities over a short period.
- Swing traders hold securities from a few days to a few weeks to take advantage of upward or downward trends in the markets.
- Traders use different technical indicators like moving averages (MA), volume, relative strength index (RSI), stochastic oscillator (SO), and ease of movement (EOM) to identify swing trading opportunities.
- Strategies used for swing trading are Fibonacci retracements, support and resistance triggers, T-line trading, and Japanese candlesticks.
- The major difference between ST and scalping lies in the time frame for trading the securities.
Swing Trading Explained
ST is a short- or medium-term trading technique that traders employ to profit from price swings of securities. Swing traders hold their positions longer than day traders but shorter than long-term investors. Thus, this method lies somewhere in between day trading and position trading.
Under ST, the traders gauge the price trends of security and then hold on to their position for a few days or more. This helps them time the market well by selling or buying at an appropriate price to make substantial gains.
The upward or downward price movement of a security is referred to as a swing. It marks a pivot from which price either falls or rises. The swing traders must try to capture a swing that is most likely to happen. If they expect an upward swing, then they must take advantage of the movement and buy at the support leveland sell at the resistance level to make maximum profit.

Day Trading vs Swing Trading Explained in Video
Strategies for Swing Trading
Here are some of the strategies used for identifying price swings in the market.
#1 – Fibonacci Retracements
It is a handy tool for the traders to know the support and resistance levels and thereby easily know the levels of reversal of security on the chart. Most of the securities do retrace their original trend before reversing. Commonly used Fibonacci retracement levels are 23.6%, 38.2%, and 61.8%. They reveal the potential reversal levels of stock.
#2 – Support and resistance triggers
Support and resistance triggers are the building block of the technical analysis of ST. At the support level, buying of security gets triggered. In contrast, resistance is where the selling of the security sets off.
At resistance, the selling trend may get reversed into the buying trend, leading to a downswing in the security price. As a result, the traders may enter into a sell position at the resistance where the price decreases, then place a stop loss just above the resistance level and earn profits.
#3 – T-line trading
It is the most profitable technique for swing traders. T-line is a line connecting the lowest points in an uptrend and the highest points in a downtrend. Whenever security closes just over the T-line, the uptrend will continue. Moreover, security that closes below the T-line will, in all probabilities, tend to be in downtrend momentum or swing. Swing traders can decide the most appropriate time for their entry and exit strategies for swing trading stocks.
#4 – Japanese candlesticks
Japanese candlesticks make it quite easy for traders to comprehend the trend of securities on the stock chart. By using the candlestick, traders identify the buying and selling pressure points. One can also formulate proper entry and exit strategies to earn maximum profits.
Let us look at this Japanese candlestick chart to understand the concept better.
As one can observe in the chart, a hammer candle, which is a form of a Japanese candlestick, appeared at the end of a downtrend on October 9, 2018. This indicated a potential bullish reversal as the bulls in the market were exerting buying pressure. Two hours later, on the same day, the buyers dominated the market, and the price went into an uptrend. If individuals entered a long position after the formation of the hammer candle, they could have generated significant gains because of the following uptrend. If individuals are interested in observing more such charts showing how Japanese candlesticks work, they can check out the various charts published on TradingView.
Swing Trading Indicators
Traders use many technical indicators to identify trading opportunities. These indicators reveal the market trend, momentum, and trading volume of securities.
#1 – Moving Average (MA)
Traders use MA to calculate the average of a security’s price movement in a given time period. It homogenizes any irregular short-term trend on the chart and reveals its underlying trend. It is also known as a lagging indicator as it is based on historical data.
Moving averages are of two types:
- Simple moving average – It is a type of MA where an average of all the closing prices of a security during a certain time frame is taken into account.
- Exponential moving average – It takes into account the current price movements of the security.
#2 – Volume
It is a solid basis of price action for buying or selling securities for traders. Volume discloses the actual strength of the ongoing trend of a security. As per convention, if the trend’s volume is high, it is more robust than a trend with a weak volume.
Usually, when the securities go beyond the support or resistance level, the situation is preceded by a low volume of trade. Therefore, in this situation, the volume of trading increases manifold.
#3 – Relative Strength Index (RSI)
It is used to identify whether a security’s price is in the oversold or overbought zone in the chart. In normal conventions, if the securities price goes above the level of 70, it is in the overbought zone; otherwise, if the security price is below 30, it is in the oversold zone.
Furthermore, if the security falls in the overbought zone, then it is most likely to reverse into a downtrend and vice versa. Hence, the oversold zone or overbought zone in the relative strength index indicates the reversal of trend. It is quite helpful in swing trading for knowing the time when the reversal of trend takes place.
#4 – Stochastic Oscillator (SO)
It is similar in nature to RSI and is a key factor in knowing the exact swing or trend of the security prices. Moreover, using a stochastic oscillator, one can contrast the net price range of securities during a certain period with their closing prices.
Like RSI, the method can identify the various overbought or oversold zones. Here, the level beyond 80 is the overbought zone, and the level below 20 is the oversold zone. Nevertheless, these zones can be a gamechanger for swing traders as they can know the point of the reverse of the trend.
#5 – Ease of Movement (EOM)
Ease of movement basically denotes the relationship between a security’s volume and price change. EOM indicates the volume required to move the prices of a security. It also represents the strength of the price trend of a security.
One can represent it with zero as a reference in the securities chart. High EOM represents easier price movements of the security and vice versa. If the value of EOM crosses zero, then it means the security must be bought, and if it is negative, then it means the security must be sold. If there is no price movement, EOM will be near zero. Hence, it acts as a key indicator of the strength of a trend of a security.
Examples
Let’s discuss some swing trading examples to understand the topic better.
Example #1
Let us assume that investor A monitors the performance of extensively traded security SECT on the exchange. For some time, Mr. A keeps observing the performance of securities in the chart. As a result, he finds that the trending price of SECT shows an upward trend.
Mr. A tries to capture the upward swing by:
- Buying the shares of SECT at a support level
- Placing a stop-loss order for the security at a price just above the previous lowest price movement
Furthermore, trader A continuously monitors the security price movement with the intention to exit the trade as the price moves to the resistance level. Moreover, as soon as the security reaches the intended exit point, the trader sells the shares of SECT to lock in the profits.
Examples #2
In this example, let us assume a company, XYZ, with the candlestick stock chart as shown below.

The chart has a cup symbol with a handle bearing the bullish signal of the security of XYZ. The swing trader will buy the XYZ security at the top level of the cup at or more than $3000. Moreover, the trader will also put an order of stop loss at the previous lowest point shown by the cup handle at $2700. Hence, for every XYZ security, the trader will have a paramount risk of $3000-$2700 = $300
In fact, if the trader wants to get a profit that is twice the risk, then he must sell at any price that is $600 (2*300) above the entry price of XYZ, i.e., $3000. Therefore, the final selling price for making a profit from swing trading will be = 3000 + 600 =$3600.
Swing Trading vs Scalping
Scalpingand ST are both stock trading strategies based on short-term price movements of securities. In scalping, traders enter into multiple trades during a trading session where they hold securities for a very short time spanning a few seconds or minutes. However, in swing trading, the traders keep their position open from a few days to several weeks before exiting a trade.
The following are the key differences between these two strategies:
- Scalping requires catching every price movement of securities, whereas the movement of securities in ST may spread over days or weeks.
- In scalping, traders monitor the tick chart or the 1 to 5 minute chart, whereas swing traders track daily and weekly charts.
- The securities are held for seconds or minutes in scalping, whereas those in ST are held for a few weeks or longer.
- In scalping, the traders have to capture the right movement multiple times in a trading session, while in ST, traders have days and weeks to time their trade.
- Scalping is more stressful than swing trading as it requires constant monitoring and quick decision-making.
- While scalping is more suitable for experienced traders, beginners can try their luck with ST.
- Scalpers make small quick profits from a large number of trades, while swing traders make large profits from few trades.
- Anyone with a small investment can trade using ST and make good profits, while scalpers need higher investment to make reasonable profits.
- ST is possible without being glued to the monitor for the whole day, whereas scalping requires one to sit in front of the system to monitor the securities for the entire day.
- Scalping requires the traders to conduct at least 100 trading in securities daily to be profitable, whereas ST has no such requirement.
For professional-grade stock and crypto charts, we recommend TradingView – one of the most trusted platforms among traders.
Disclosure: This article contains affiliate links. If you sign up through these links, we may earn a small commission at no extra cost to you.
Frequently Asked Questions (FAQs)
What’s swing trading?
It is a speculative strategy for trading securities in which traders hold a security for a few days or weeks to profit from short-term price changes or swings. However, since their positions remain open for days or weeks, they are exposed to some risks too.
What is swing trading forex?
Swing trading (ST) is quite popular for Forex market traders because the forex market has all the best conditions for swing trading like higher liquidity, high trading volume, narrower bid-ask spreads, and twenty-four hours of operation. Therefore, ST is ideal for extracting profit from the crest and trough of the momentum in currency trading in the forex market.
Is swing trading profitable?
Yes, swing trading is profitable in the long term if done consistently. It is a strategy of getting profits from short-term price trends. The profitability from swing trade depends on the size of trades, opportunities traders can utilize, and their trading strategy. Most often, ST is more effective upon single trades of securities.
Recommended Articles
This has been a guide to Swing Trading & its Meaning. Here we discuss swing trading in the stock market, along with its strategies, indicators & examples. You can learn more from the following articles –