What is Volatility Formula?
The term “volatility” refers to the statistical measure of the dispersion of returns during a certain period of time for stocks, security, or market index. The volatility can be calculated either using the standard deviation or the variance of the security or stock.
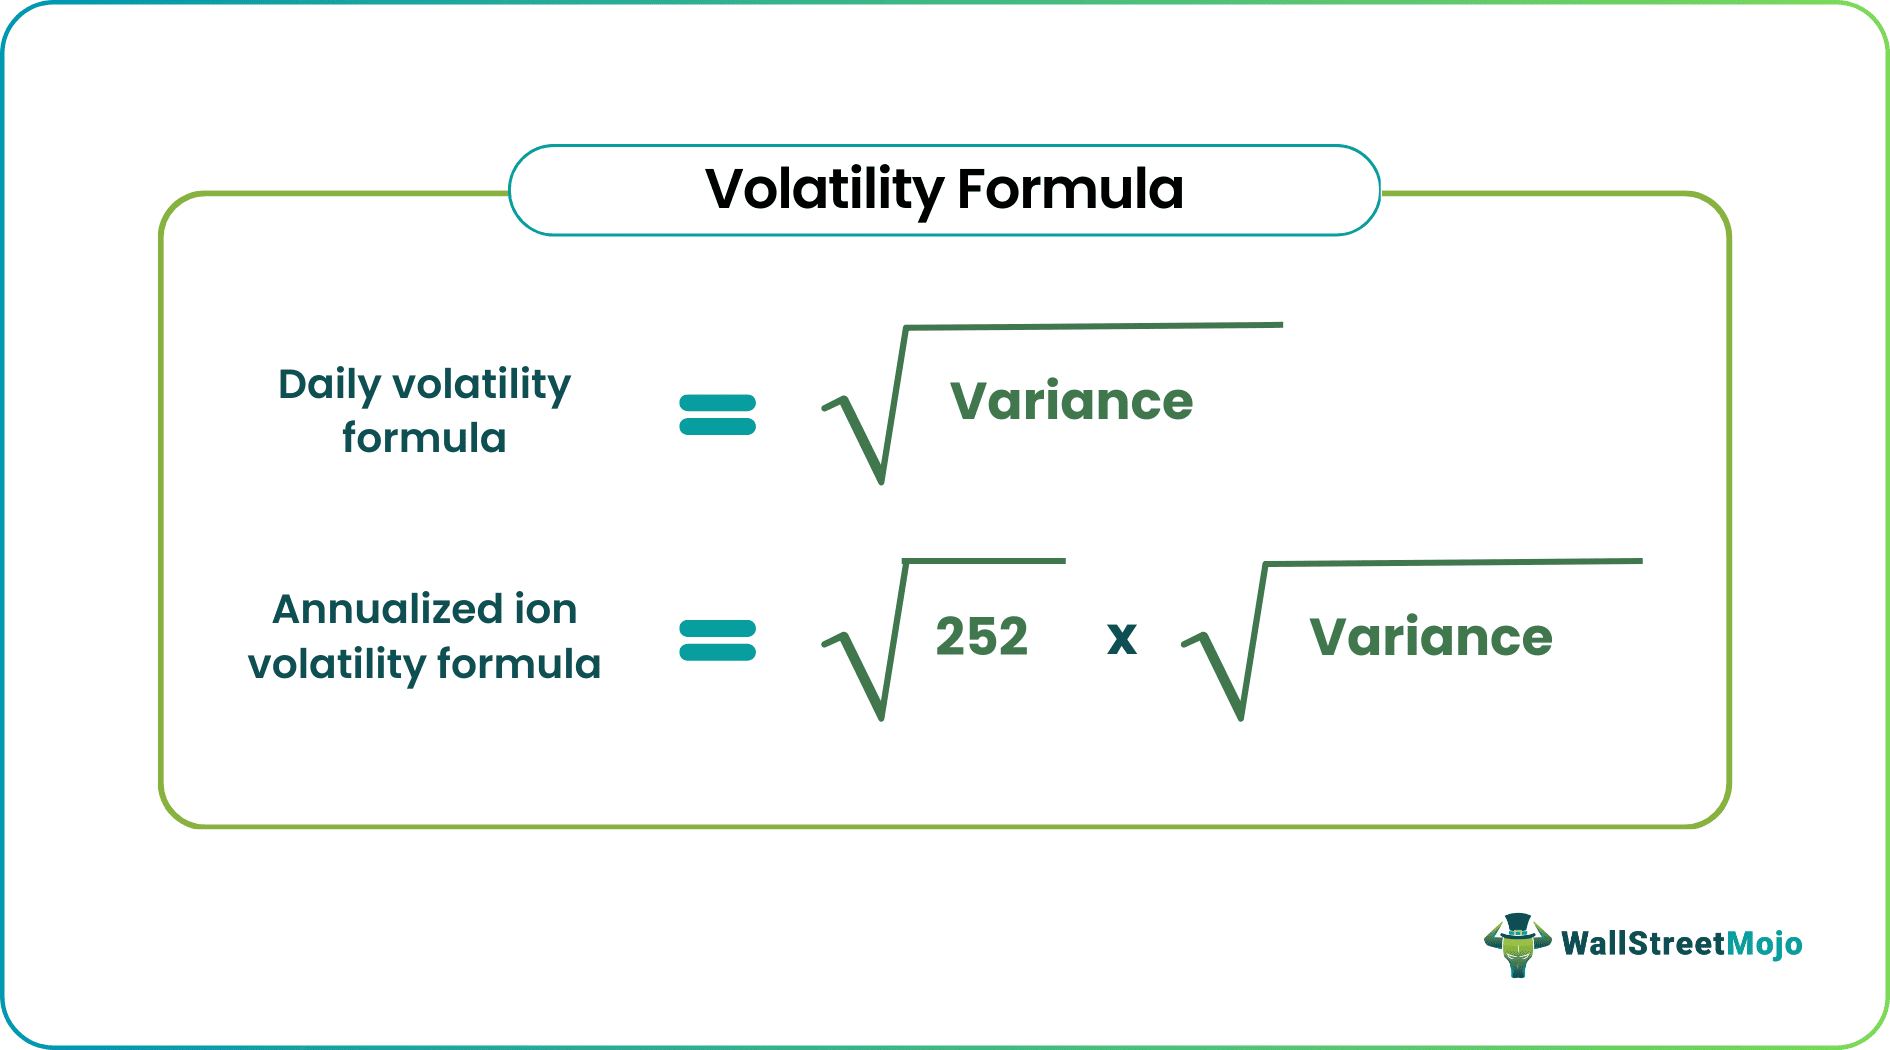
The formula for daily volatility is computed by finding out the square root of the variance of a daily stock price.
Daily Volatility Formula is represented as,
Daily Volatility formula = √Variance
Further, the annualized volatility formula is calculated by multiplying the daily volatility by a square root of 252.
Annualized Volatility Formula is represented as,
Annualized Volatility Formula = √252 * √Variance
Explanation of the Volatility Formula
The formula for the volatility of a particular stock can be derived by using the following steps:
Firstly, gather daily stock price and then determine the mean of the stock price. Let us assume the daily stock price on an ith day as Pi and the mean price as Pav.
Next, compute the difference between each day’s stock price and the mean price, i.e., Pi – P.
Next, compute the square of all the deviations, i.e. (Pav – Pi)2.
Next, find the summation of all the squared deviations, i.e. ∑ (Pav – Pi)2.
Next, divide the summation of all the squared deviations by the number of daily stock prices, say n. It is called the variance of the stock price.
Variance = ∑ (Pav – Pi)2 / nNext, compute the daily volatility or standard deviation by calculating the square root of the variance of the stock.
Daily volatility = √(∑ (Pav – Pi)2 / n)- Next, the annualized volatility formula is calculated by multiplying the daily volatility by the square root of 252. Here, 252 is the number of trading days in a year.
Annualized volatility = = √252 * √(∑ (Pav – Pi)2 / n)
Many traders use Saxo Bank International to research and invest in stocks across different markets. Its features like SAXO Stocks offer access to a wide range of global equities for investors.
Example of Volatility Formula (with Excel Template)
Let us take the example of Apple Inc.’s stock price movement during the last one month, i.e., January 14, 2019, to February 13, 2019. Calculate the daily volatility and annual volatility of Apple Inc. during the period.
Below is data for calculation of daily volatility and annualized volatility of Apple Inc

Based on the given stock prices, the median stock price during the period is calculated as $162.23.
The deviation of each day’s stock price with the mean stock price is calculated in the third column, while the square of the deviation is calculated in the fourth column. The summation of the squared deviation is computed to be 1454.7040.
Variance
Now, the variance is calculated by dividing the sum of squared deviation by the number of daily stock prices, i.e., 24,
Variance = 1454.7040 / 24

Variance = 66.1229
Daily Volatility
Now, the daily volatility is calculated by finding out the square root of the variance,

Therefore, the calculation of Daily Volatility will be,
Daily volatility = √66.1229

Daily volatility = 8.1316
Annualized Volatility
Now, the annualized volatility is calculated by multiplying the square root of 252 to the daily volatility,

Therefore, the calculation of Annualized Volatility will be,
Annualized volatility = √252 * 8.1316

Annualized Volatility = 129.0851
Therefore, the daily volatility and annualized volatility of Apple Inc.’s stock price is calculated to be 8.1316 and 129.0851, respectively.
Relevance and Use
From the point of view of an investor, it is essential to understand the concept of volatility because it refers to the measure of risk or uncertainty pertaining to the quantum of changes in the value of a security or stock. Higher volatility indicates that the value of the stock can be spread out over a larger range of values, which eventually means that the value of the stock can potentially move in either direction significantly over a short period. On the other hand, lower volatility indicates that the value of the stock would not fluctuate much and will continue to remain stable over the period.
One of the major applications of volatility is the Volatility Index or VIX, which was created by the Chicago Board of Options Exchange. VIX is a measure of the 30-day expected volatility of the U.S. stock market computed based on real-time quote prices of S&P 500 call and put options.
Disclosure: This article contains affiliate links. If you sign up through these links, we may earn a small commission at no extra cost to you.
Recommended Articles
This article has been a guide to Volatility Formula. Here we discuss how to calculate the Daily and Annualized Volatility and the practical example and downloadable excel sheet. You can learn more about accounting from the following articles –