What is Volatility Index?
The volatility Index, abbreviated as VIX, indicates the expected volatility in the stock market and is based on S&P 500 index options based on a 30 days forward period. This index was created by Chicago’s Board Options Exchange and is also known as CBOE Volatility Index. It is a reliable measuring index for institutional sentiments. It also favors long and short puts.
When the VIX is low, it indicates low volatility in the market. On the contrary, a high VIX indicates high volatility and traders keep a close eye on this index to incorporate their volatility index trading accordingly. The most common strategy is to buy when the VIX is high and sell when it is low while considering other indicators and factors.
- The volatility index (VIX) gauges anticipated stock market volatility by analyzing S&P 500 index options over a 30-day forward period. This index, often referred to as the CBOE Volatility Index originated from the Chicago Board Options Exchange.
- Investors leverage the Volatility Index (VIX) to time their market transactions. By monitoring the trend of the volatility index, users can make informed decisions and capitalize on its insights.
- An inverse correlation exists between the market and the VIX. When this connection holds for a specific duration, the prevailing stock direction is viewed as short-lived, suggesting potential unsustainability.
How does the Volatility Index Work?
Volatility index or VIX is the measurement or an indicator of the volatility in the market. The Chicago Board of Options Exchange (CBOE) creates and tracks the VIX which shows the implied volatility of S&P 500 index options.
In the case of the stock market the term volatility refers to a statistical measurement of the degree of change in the prices of stock market products over time. The VIX calculated the expected volatility based on the call and put option prices of S&P 500 stocks. The weighted average prices of the S&P 500 put, and call options are added together for several strike prices. The midpoints of the bid and ask prices of options are considered for index calculations.
The history of VIX can be traced back to 1993 when the Chicago Board Options Exchange (CBOE) announced the index launch. At that time, the index was measured as a weighted average of the implied volatility of the total eight options of the 30 days S&P 100 index. Later in the year 2003, CBOE worked in collision with Goldman Sachs and replaced the S&P 100 index with the S & P 500 index. Since then, the same method continues to be used to date. Further, futures and options were introduced for VIX trading in 2004 and 2006, respectively.
Two kinds of S&P options are considered for VIX, i.e., those that expire on the third Friday of every month and those that expire every Friday. The weighted average of the options prices is then calculated to determine the index value per CBOE.
The volatility index strategy is being used for determining the movements in the stocks of the S&P 500. There exists an inverse relationship between the market and the index. When this relationship doesn’t follow for a particular period, the present direction of stocks is said to be unsustainable for a short period.
Many traders use Saxo Bank International to research and invest in stocks across different markets. Its features like SAXO Stocks offer access to a wide range of global equities for investors.
Chart
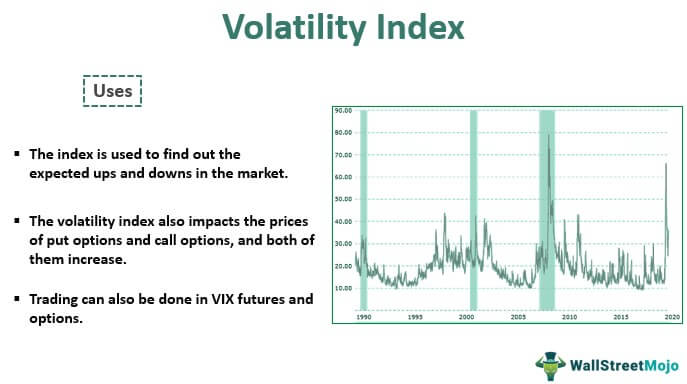
Below is a historical graph that shows the Index values for different years. The years are represented on the x-axis, and the respective VIX values are represented on the y-axis. This chart will help us understand volatility index trading and the market sentiments in the market for close to two decades.

The index value, as on 17th July 2020, is at 25.68. As mentioned earlier, the index indicates market volatility over the next 30 days.
Interpretation
Now that we understand the basics of the concept, it is important for us to understand the interpretation of the data that can be found through the VIX. Let us do so through the discussion below.
The index is expressed as a percentage and represents the expected annualized movement of the S&P 500 during the upcoming 30 days. For example, when the index stands at 36, it indicates that the expected movement in the S&P 500 in the next 30 days is 3% (i.e., 36% divided by 12 months).
When the market is showing an upward trend, there appears to be less volatility as the investors’ confidence increases, and they tend to buy more calls rather than puts. On the other hand, when the market is on a falling end, it creates panic amongst the market players and they incorporate their volatility index strategy of put options bought instead of call options, leading to more volatility in the market. Thus, in a bullish market, VIX is generally lower due to less volatility, and in a bearish market, VIX is higher due to unrest. Thus, there exists an inverse relationship between market performance and the index.
Criticism
Analysts and market experts have been heavily critical of the volatility index trading as this index is often used to predict the future market volatility. Let us understand their perspectives and why the criticism arises often through the explanation below.
- The intensity with which VIX forecasts volatility is equivalent to that of simple methods such as simple past volatility.
- The only thing VIX tracks are price inverse, and predictive power is absent in VIX.
- VIX represents only implied volatility as it cannot predict volatility in case of abnormal conditions in the future.
- VIX was also alleged to be manipulated by an unknown whistleblower.
Uses
Investors can use the Volatility Index (VIX) to decide the timing of the trades in the market. The users can analyze the trend in the volatility index and make the best use of it to its advantage as follows –
- The volatility index strategy is used to determine the market’s expected ups and downs. When the high index indicates a downfall in the stock market when the VIX shows a significant increase, there will be some major change in the market, and it is the best time to act.
- The volatility index also impacts the prices of put options and call options, which both increase. When the index is high, the higher premiums should be considered to decide whether to hold the options or buy them.
- Trading can also be done in VIX futures and options. A lot of investment opportunities are available for the same.
Disclosure: This article contains affiliate links. If you sign up through these links, we may earn a small commission at no extra cost to you.
Frequently Asked Questions (FAQs)
1.Can the volatility index predict market crashes?
While the volatility index can indicate increased market uncertainty, it does not directly predict market crashes. It provides insight into market sentiment and potential volatility, but other factors also contribute to market movements.
2.Are there other volatility indices for different markets?
Yes, various volatility indices exist for different markets and asset classes. For example, the VXN measures volatility for the Nasdaq-100 index, and the VXD measures volatility for the Dow Jones Industrial Average.
3.Does the volatility index only measure downside risk?
While the volatility index is often associated with downside risk, it reflects both upside and downside potential price movements. Higher volatility means greater uncertainty in both directions.
4.Can the volatility index be influenced by external events?
Yes, external events such as geopolitical tensions, economic data releases, and global crises can impact market sentiment and contribute to changes in the volatility index. It is sensitive to news and developments that may affect market expectations.
Recommended Articles
This has been a guide to what is Volatility Index (VIX). Here we explain its history along with its chart, uses, criticism, & interpretation. You may learn more about financing from the following articles –