Part of our Data Analysis in Excel guide
What is Exponential Smoothing in Excel?
Exponential Smoothing is one of the top three sales forecasting methods used in statistics. It is a more realistic forecasting method to picture the business better.
- Exponential Smoothing logic will be the same as other forecasting methods, but this method works based on weighted averaging factors. The older the data, the less weight or priority it has. The fresher data or relevant data is given more importance or significance.
- Even though Exponential Smoothing is considered old data series, it favors the most recent observations or data series.
Types of Exponential Smoothing in Excel
There are mainly three types of Exponential Smoothing available in Excel.
- Simple / Single Exponential Smoothing: In this type, α (alpha) is close to the zero value. When α (alpha) is close to zero, the smoothing rate is very slow.
- Double Exponential Smoothing: This method is suitable for analyzing the data, which shows more trend indicators.
- Triple Exponential Smoothing: This method is suitable for the data, showing more trend and seasonality in the series.
Where to Find Exponential Smoothing in Excel?
Exponential Smoothing is part of many “Data Analysis” tools in Excel. However, by default, it is not visible in Excel. If your Excel does not show the “Data Analysis” tool, follow our old articles to “Unhide Data Analysis Toolpak.”
We must see the “Data Analysis” option under the “Data” tab if it is unhidden.
Click on the “Data Analysis,” and we may see many statistical techniques. However, in this article, we will concentrate on “Exponential Smoothing.”

How to do Exponential Smoothing in Excel?
Below are examples of doing Exponential Smoothing in Excel.
Exponential Smoothing Example #1 – Sales Forecast
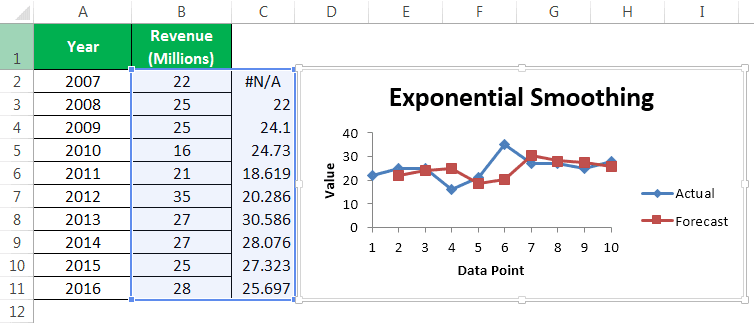
We will see one simple data to do the sales forecast for next year. We have 10 years of revenue data.Using Exponential Smoothing, we need to forecast the revenue.
- We must first click on the “Data” tab and “Data Analysis.”

- After that, select the “Exponential Smoothing” option.

- For the “Input Range,” we must specify the available data points. For example, our data range is B1:B11.

- The “Damping factor” will smooth out the graph. The values should be between 0 to 1. Technically it is 1 – α (alpha). We have mentioned 0.3 as the “Damping factor.”

- Since we have selected our heading in the “Input Range,” we need to tick the checkbox “Labels.”

- We must select the range to display the “Output Range.” We have chosen the next column of the existing data, C2.

- Now, we need to tell whether we need a chart to represent the data graphically or not. Of course, it is always a good practice to represent the data graphically. So, we must select the “Chart Output.”

- We have now completed all the fields. Now, we must click on “OK” to get the results.
Explanation:We have set the “Damping factor” to 0.3, and alpha becomes 0.7. It shows that current values (recent years’ revenue values) have given a weight of 70% and have a weight of 30% for relatively old values.A graph shows more or less the same trend in this method. As there is no previous value for 2007, Excel cannot calculate the smoothed value. Therefore, the smoothed value of the second data series is always equal to the first data point.


Exponential Smoothing Example #2 – Forecast Trend at Different Damping Factors
We will see a forecast trend at different damping factors. For this example, we are using monthly sales trend data.
So, we must insert these numbers into the Excel sheet vertically.
Step 1: First, we must click on the “Data” tab and “Data Analysis.”

Step 2: Then, we must select the “Exponential Smoothing” option.
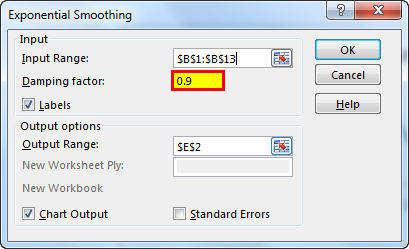
Step 3: For “Input Range,” we must select the available previous revenue details. The “Damping factor” is 0.1.
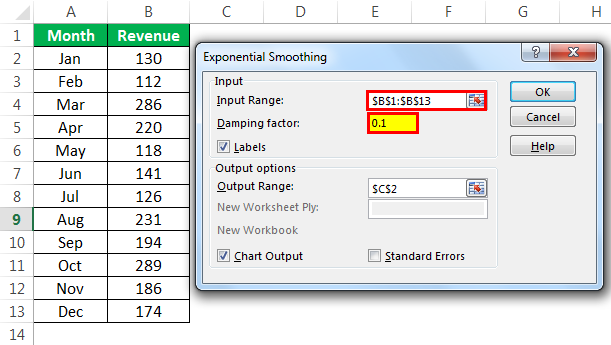
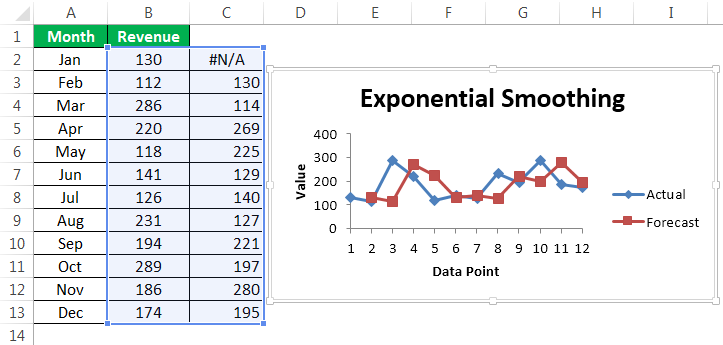
Step 4: Now, click on “OK.” It shows the forecast results if the “Damping factor” is 0.1
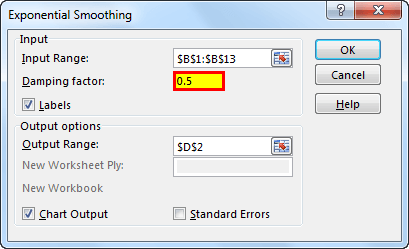
We must run Exponential Smoothing twice by changing the “Damping factor” to 0.5 and 0.9.
Damping Factor @ 0.5
Damping Factor @ 0.9
We have got all three different results.

Now, we will draw a graph for it. So, we must first select the data and go to the “Insert” tab to choose the “Line” chart.

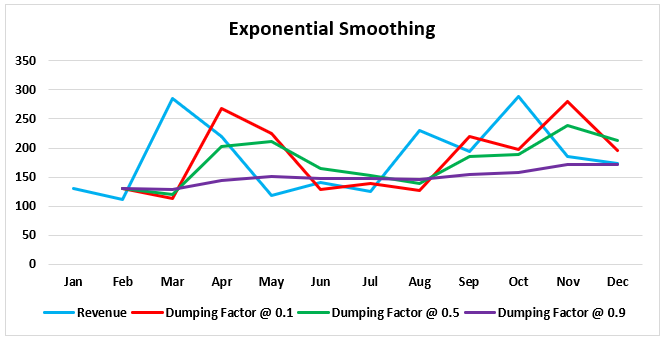
The chart should look like the one below. Of course, we can modify the chart as per the requirement. We have changed the “Chart Title” and line color in this graph.
Explanation
- We must carefully observe the graph. The graph’s line or data becomes smooth as the damping factor increases.
- The damping factor is 0.1 means alpha is 0.9. So, we have more volatility in the data.
- The damping factor is 0.9 means alpha is 0.1. So, we have less volatility in the data.
Things to Remember About Exponential Smoothing in Excel
- The alpha value will be 0-1 (damping value) and vice versa.
- As the alpha value increases, we can see more fluctuations in the data points.
- If the “Input Range” includes headings, we must tick the “Labels” option.
- The ideal damping values should be 0.2 to 0.3.
Recommended Articles
This article is a guide to Exponential Smoothing in Excel. Here, we discuss how to do Exponential Smoothing in Excel, practical examples, and a downloadable Excel template. You may learn more about Excel from the following articles: –