What Is Moving Average In Excel?
Moving Average in Excel calculates the average of the selected numeric values in subsets in a large dataset to identify a trend or a pattern to predict the future w.r.t data variations. It takes an input range and output range with intervals as an output.
There are 3 types of Excel Moving Average, namely, simple moving average, weighted moving average, and exponential moving average.
For example, we have a data table as shown below.
Select cell D5, enter the formula =(C4+C3+C4)/3, press “Enter”, and drag the formula from D5 to D8 using the fill handle.
The output is shown above. Cell D5 returns the moving average for the previous 3 months, and so on for the rest of the dragged cells.
Key Takeaways
- The Moving Average in Excel helps users find the average of values in 3 different methods, such as simple moving average, weighted moving average, and exponential moving average.
- The simple moving average can be calculated using an AVERAGE function in Excel.
- The exponential Moving Average gives more weight to the recent data than the simple moving average. Therefore, smoothening in the case of the exponential Moving Average in Excel is more than that of the simple moving average.
- Moving average is a widely used time series analysis technique to predict the future. The moving averages in a time series are constructed by taking averages of various sequential values of another time-series data.
Three types of Excel Moving Average
The three Excel Moving Average types are,
- Simple Moving Average.
- Weighted Moving Average.
- Exponential Moving Average.
#1 – Simple Moving Average
It helps calculate the average of a data series’ last number of periods.
For example, if the prices of n period are given, then the simple moving average formula is,
“Simple moving average= [P1+P2+………….+Pn]/n“
#2 – Weighted Moving Average
It provides the weighted average of the last n periods. The weighting decreases with each data point of the previous period. The formula is
“Weighted moving average = (Price * weighting factor) + (Price of previous period * weighting factor-1)”
#3 – Exponential Moving Average
It is similar to a simple moving average that measures trends over time. However, while a simple moving average calculates an average of given data, an exponential moving average attaches more weight to the current data. The formula is,
“Exponential moving average =(K x (C – P)) + P”
Where,
- K = Exponential smoothing constant.
- C = Current price.
- P = Previous periods exponential moving average (simple moving average used for first periods calculation).
How To Calculate Moving Average In Excel?
We can calculate the Excel Moving Average using the built-in feature as follows:
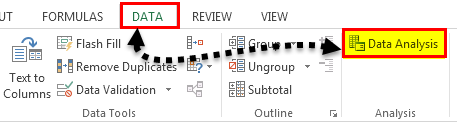
First, select the “Data” tab – go to the “Analysis” group – click the “Data Analysis” option.

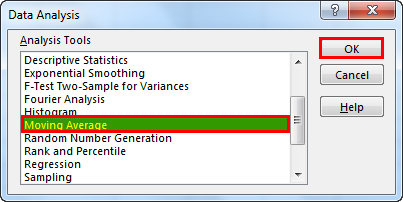
The “Data Analysis” window appears. Here, select the “Moving Average” option from the “Analysis Tools” window, and click “OK”.

Examples
We will consider some examples to calculate the Moving Average in Excel.
Example #1 – Simple Moving Average in Excel
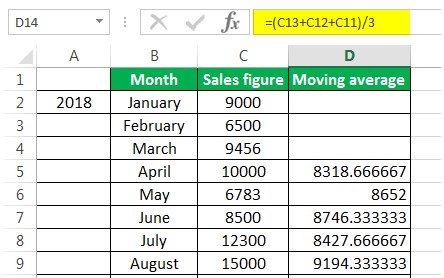
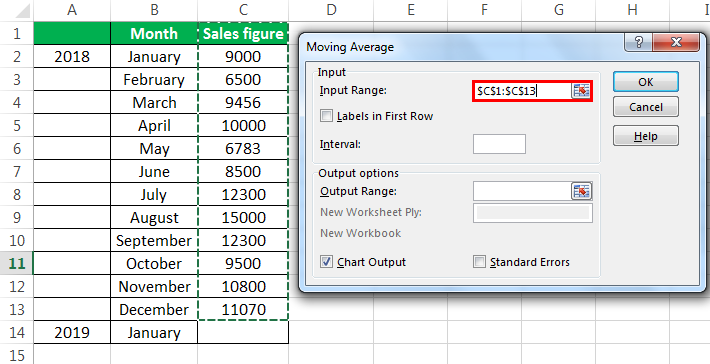
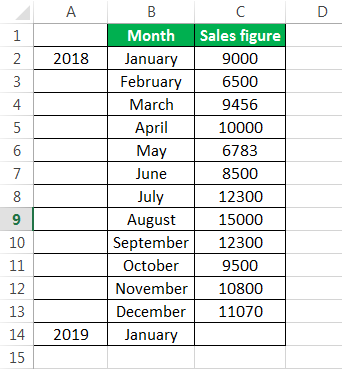
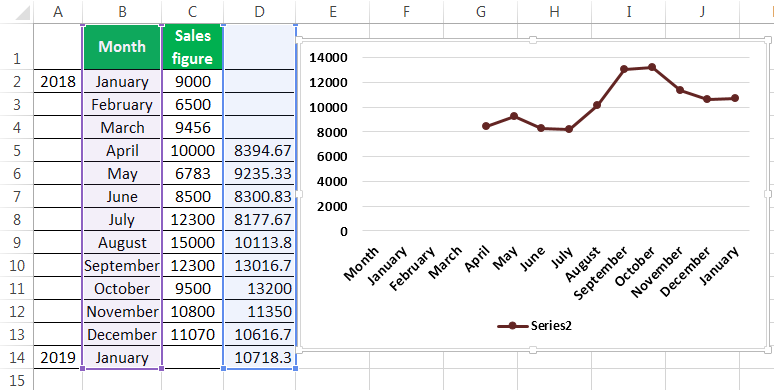
To calculate the simple moving average, we have taken a company’s sales data from January to December 2018. Our target is to smooth the data and to know the sales figure in January 2019. Therefore, we will use the three months moving average here.
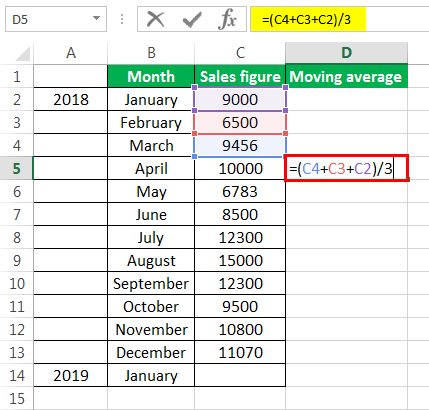
- The moving average of January, February, and March is calculated by taking the months’ sales figures and then dividing them by 3, i.e., =(C4+C3+C4)/3 in cell D5.
Press “Enter”, and we get the output as shown in cell D5.

- Selecting at the corner of the D5 cell and then just dragging and dropping down will give the moving average for the remaining periods. It is Excel’s “Fill” tool function.
The sales prediction for January 2019 is10456.66667.

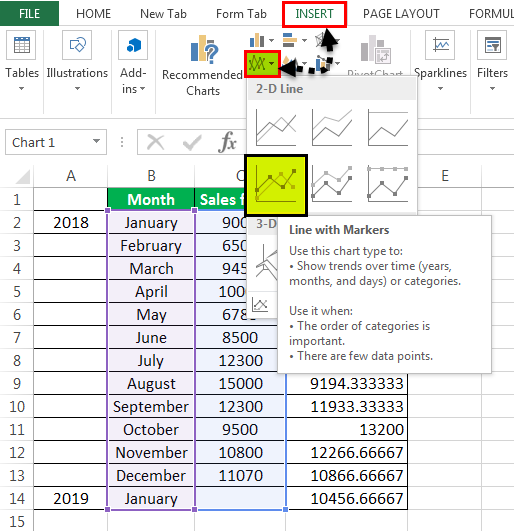
- Now, we plot the sales figure and moving average in the Line Graph to understand the difference in trend. We can do this from the “Insert” tab. Firstly, we have selected the data series, and then from the “Charts” section under “Insert,” we have used the “Line” graph.
The followingLine Chartis generated.After creating the graphs, it can be seen that the graph with the moving average is much more smoothed out than the original data series.

Example #2 – Simple Moving Average through Data Analysis Tab in Excel
- Under the “Data” tab under the “Analysis” group, we have to click “Data Analysis”. For example, the following is the screenshot.
- From the “Data Analysis,” we can access the “Moving Average.”
- After clicking the “Moving Average,” we must select the sales figure as the “Input Range.”
- The “Labels in the first row” is clicked to make Excel understand that the first row has the label name.
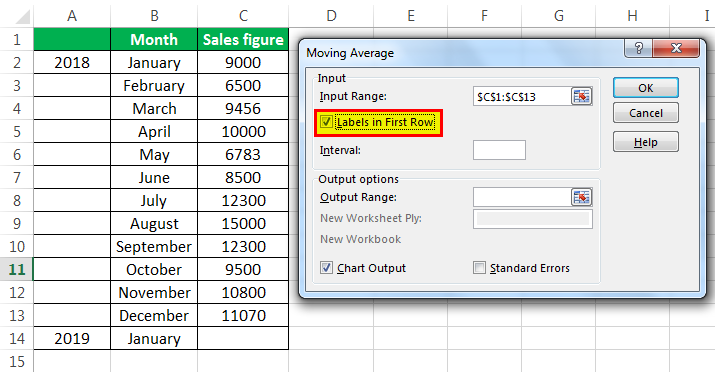
- Interval 3 is selected because we want three years moving average.
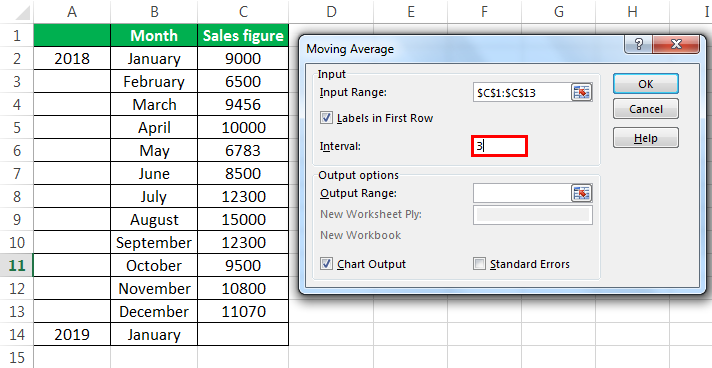
- We have chosen the “Output Range” with adjacency to the sales figure.
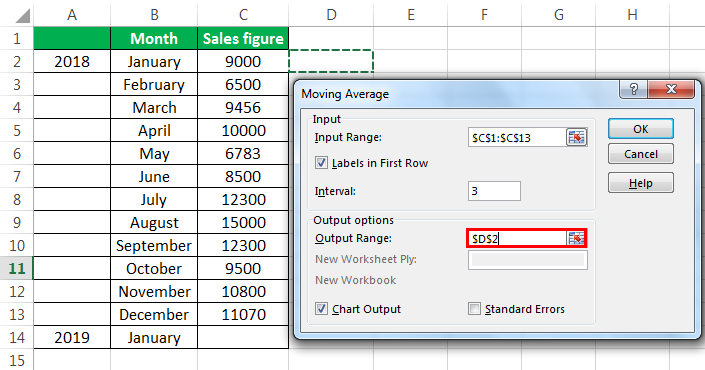
- We also want to see the “Chart Output,” wherein we can see the actual and forecasted differences.

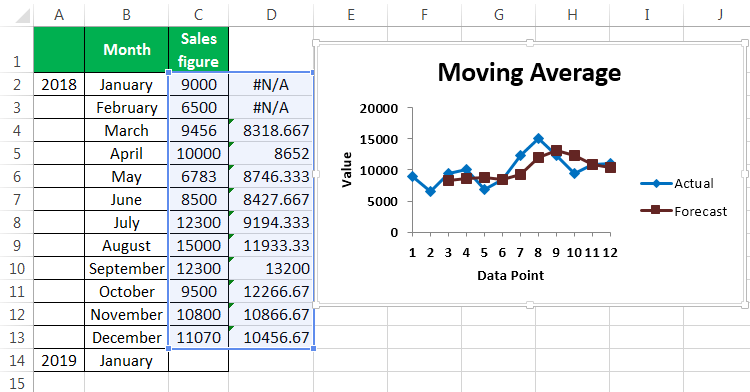
This chart shows the difference between the actual and forecasted moving average.
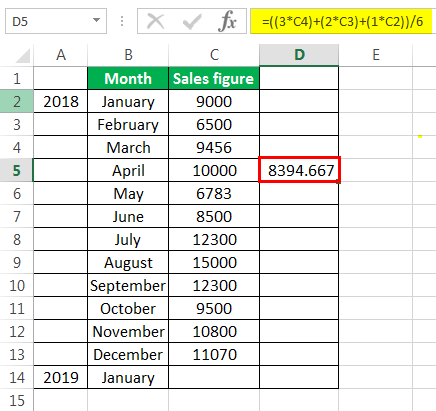
Example #3 – Weighted Moving Average in Excel
We use the three years weighted moving average, and the formula is given in the screenshot.

After using the formula, we got the moving average for a period.
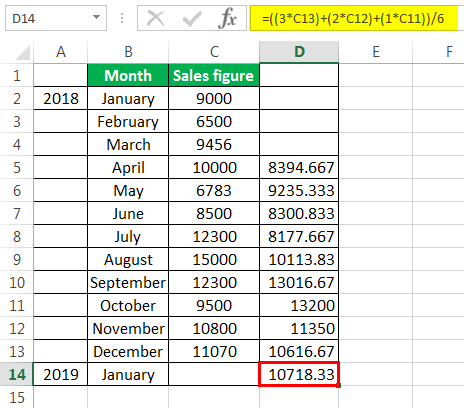
We got the moving average for all other periods by dragging and dropping values in the remaining cells, as shown below.
The forecast for January 2019 is 10718.33.
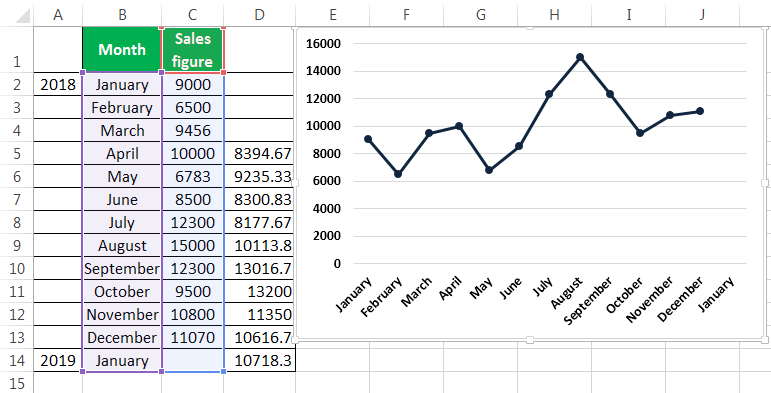
Now, we took the Line Graph to see the smoothing of data. For this, we have selected our month and the forecasted data, and then inserted a Line Graph.

Now, we will compare our forecasted data with our actual data.
In the screenshots below, we can easily see the difference between the actual and forecasted data. The graph on the top is the actual data, and the graph below is the moving average and forecasted data. We can see that the moving average graph has smoothened significantly compared to the graph containing the actual data.
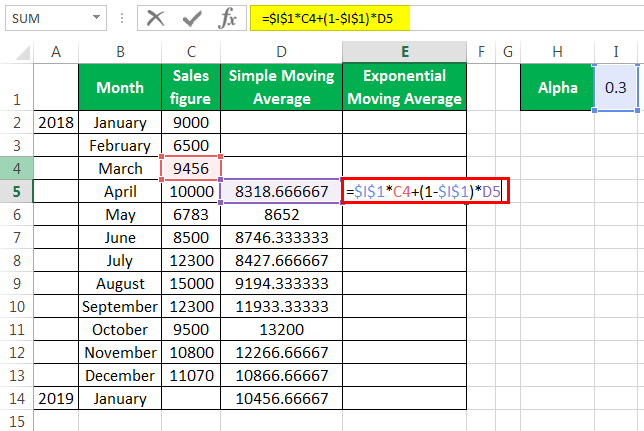
Example #4 – Exponential Moving Average in Excel
The formula for the exponential moving average is St=α.Yt-1+(1- α)St-1……(1)
Where,
- Yt-1 = actual observation in the t-1th period
- St-1= simple moving average in the t-1th period
- α = smoothening factor, and it varies between .1 and .3. The greater the value of α closer is the chart to the actual values, and the lessen the value of the α, the more smooth the chart will be.
First, we calculate the simple moving average, as shown earlier. After that, we apply the formula given in equation (1). For fixing the α value for all the following values, we have pressed F4.
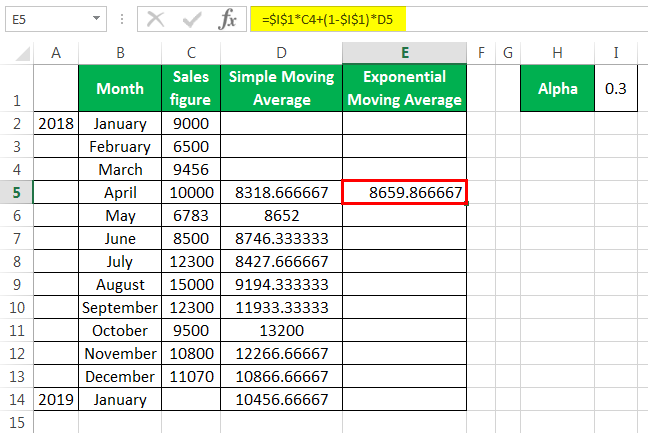
We get the values by dragging and dropping them in the following cells.
Now, we want to see the comparison between the actual values, simple moving average, and exponential Moving Average in Excel. We have done this by doing a line chart.
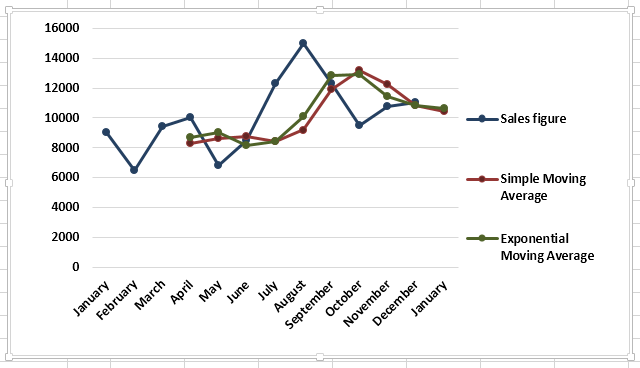
The above screenshot shows the difference between Excel’s actual sales figure, simple moving average, and exponential moving average.
Important Things To Note
- Ensure to select numeric values to calculate the average in any method, else the cell value with non-numeric value will be ignored.
- Seasonal averages are often termed a seasonal index.
- Moving average helps in smoothing the data. The moving average helps the trader identify the trend more easily in businesses like the stock market.
Frequently Asked Questions (FAQs)
Where is the Average function to calculate a Simple moving Average?
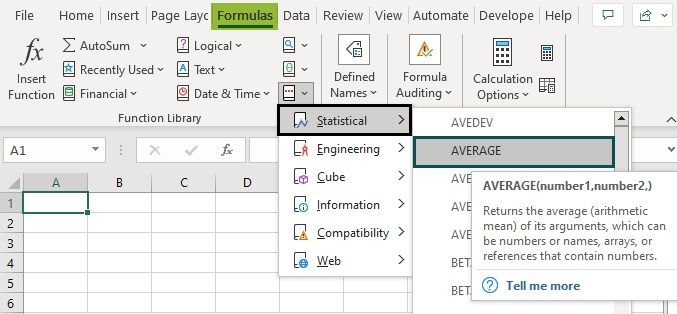
The Average function is found as follows:
First, choose the numeric values – select the “Formulas” tab – go to the “Function Library” group – click the “More Functions…” option drop-down – click the “Statistical” option right-arrow – select the “Average” function, as shown below.
Why is the Moving Average in Excel not working?
A few reasons the Moving Average in Excel may not work are,
- The cell values may have blank, empty cells, or alpha-numeric cells, which are ignored by the formula during the calculation. This may result in incorrect results.
- The function name is not rightly entered, which may result in a “#NAME?” error.
- The values for the formula are incorrectly referenced.
- The cell references for the formula might have been deleted, changed from the dataset.
Where is the Line Graph found to plot the Moving Average in Excel?
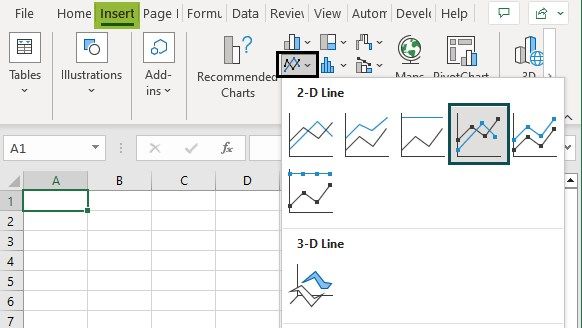
The Line graph is found as follows:
First, choose the data range – select the “Insert” tab – go to the “Charts” group – click the “Insert Line or Area Chart” option drop-down – select the “Line with Markers” chart type from the “2-D Line” category, as shown below, to generate a Line Chart.
Recommended Articles
This article is a guide to Moving Average in Excel. Here we calculate moving average, Simple, Weighted, Exponential ways, examples, downloadable excel template. You may learn more about Excel from the following articles: –