Excel Linear Regression
Linear regression is a statistical tool in Excel used as a predictive analysis model to check the relationship between two sets of data or variables. We can estimate the relationship between two or more variables using this analysis. For example, we can see two variables: dependent and independent variables.
- The dependent variable is the factor we are trying to estimate.
- The independent variable is the factor that influences the dependent variable.
So, using Excel linear regression, we can see how the dependent variable goes through changes when the independent variable changes and helps us to decide which variable has a real impact mathematically.
How to Add Linear Regression Data Analysis Tool in Excel?
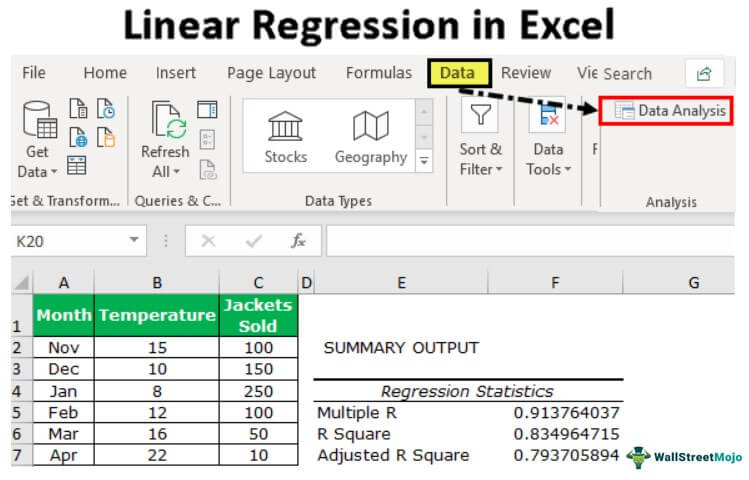
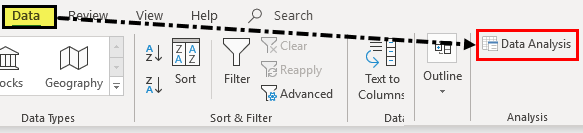
Linear Regression in excel is available under analysis toolpak, a hidden tool in Excel. We can find this under the “Data” tab.
This tool is not visible until the user enables this. To enable this, follow the below steps.
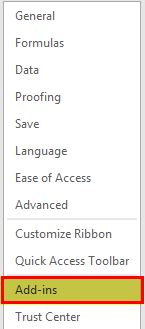
- We must first go to the FILES >>Options.

- Then, click on “Add-ins” under “Excel Options.”

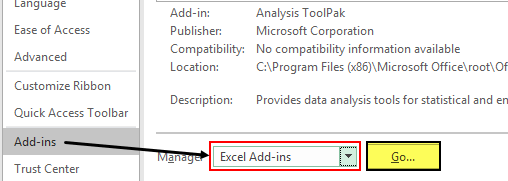
- Select “Excel Add-ins” under the “Manage” dropdown list in Excel and click on “Go.”

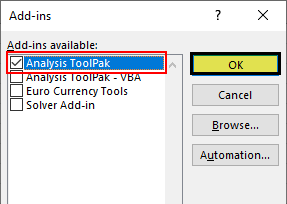
- Check the box “Analysis ToolPak” in the “Add-Ins.”

- Now, we should see the ” Data Analysis” option under the “Data” tab.


With this option, we can conduct many “Data Analysis” options. Let us see some of the examples now.
Examples
As we told you, linear regression Excel consists of two things: dependent and independent variables. For this example, we will use the below data of winter season jacket sold data with temperature in each month.
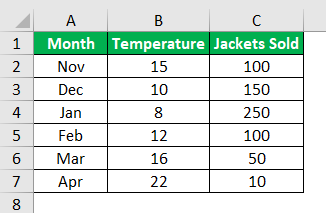
We have each month’s average temperature and jacket sold data. Here, we need to know which independent and dependent variables are.
Here “Temperature” is the independent variable because one cannot control the temperature, so this is the independent variable.
“Jackets Sold” is the dependent variable because the temperature increases and decreases in jacket sales.
Now, we will do the Excel linear regression analysis for this data.
- Step 1: We must click on the “Data” tab and “Data Analysis.”
- Step 2: Once we click on “Data Analysis,” we will see the below window. Scroll down and select “Regression” in excel.
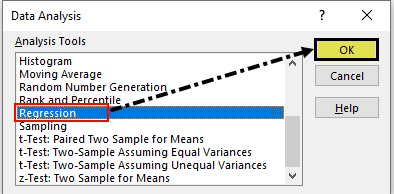
- Step 3: Select the “Regression” option and click on “OK” to open the window below.
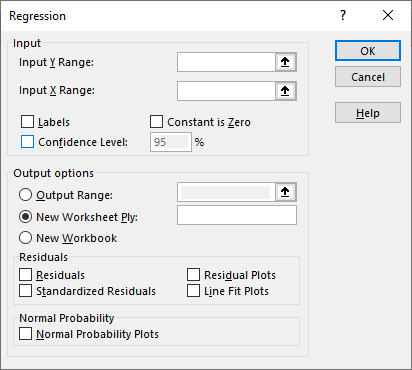
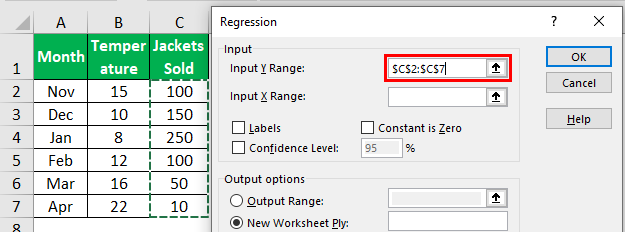
- Step 4: Here, the “Input Y Range” is the dependent variable, so in this case, our dependent variable is “Jackets Sold” data.
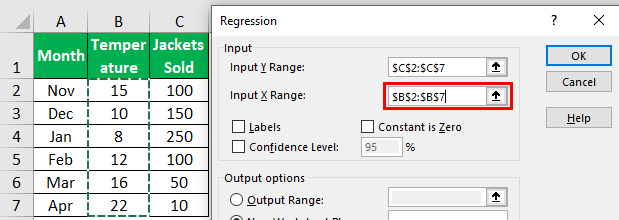
- Step 5: The “Input X Range” is the independent variable, so in this case, our independent variable is “Temperature” data.
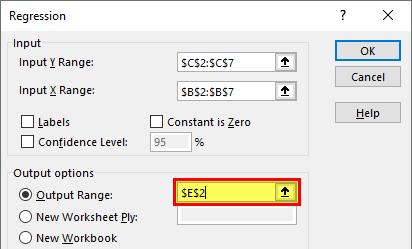
- Step 6: Select the output range as one of the cells.
- Step 7: To get the difference between the predicted and actual values, check the “Residuals” box.
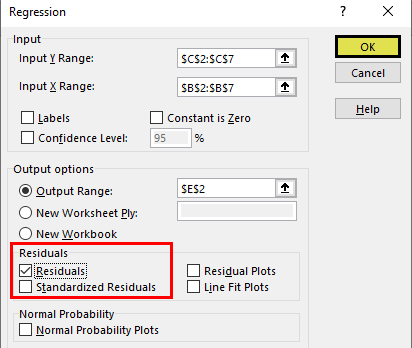
- Step 8: Click on the “OK.” We will have the below analysis.

The first part of the analysis is “Regression Statistics.”

Multiple R: This calculation refers to the correlation coefficient, which measures the strength of a linear relationship between two variables. The Correlation Coefficient is the value between -1 and 1.
- 1 Indicates a strong positive relationship.
- -1 indicates a strong negative relationship.
- 0 indicates no relationship.
R Square: It is the coefficient of determination used to indicate the goodness of fit.
Adjusted R Square: This is the adjusted value for R Square based on the number of independent variables in the data set.
Things to Remember
- We can also use the LINEST function in excel.
- We need to have a strong knowledge of statistics to interpret the data.
- If the data analysis is not visible under the “Data” tab, we need to enable this option under the “Add-ins” option.
Recommended Articles
This article is a guide to Linear Regression in Excel. We discuss linear regression data analysis in Excel, examples, and a downloadable Excel template. You may also look at these useful functions in Excel: –