Table of Contents
What Are Forecast Errors?
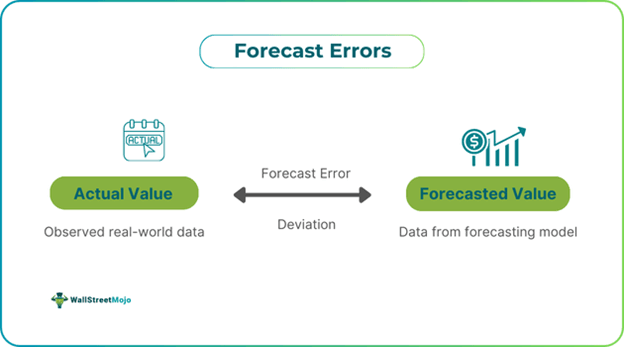
Forecast error is a measure that reveals the accuracy of a forecast by comparing predicted values with actual outcomes for a given period. The error can be positive or negative, depending on whether the forecast is overestimated or underestimated.
Errors in forecasting are used to identify discrepancies in forecasting models and assess their accuracy. A high error rate indicates the need for revisions and improvements. Forecast errors have many applications, particularly in responding to customer demands and preparing for the future, especially in business contexts.
Key Takeaways
- Forecasting error measures the deviation between predicted and actual results. It is applicable in fields such as business, statistics, supply chain management, and inventory management.
- It highlights deviations, aids in decision-making, and supports business inventory management and resource allocation.
- Errors often arise from data quality issues, external factors, model bias, and incorrect parameter selection. Common methods to calculate errors include MAD, MAPE, MSE, mean, and bias.
- Minimizing errors involves adopting robust models, combining various approaches, and analyzing different scenarios.
Forecast Errors Explained
Forecast error refers to the gap between actual results and predicted outcomes. It can be applied in various fields, such as business, supply chain management, and product demand forecasting. Forecast errors help identify process disruptions, inform decision-making, and guide the next steps. For example, they help prevent issues like overstocking inventory, running out of stock, or encountering supply chain disruptions.
These calculations provide businesses with a quantitative assessment of the accuracy of past forecasts. They aid in inventory management, production planning, supply chain coordination, and resource allocation. From a statistical perspective, they also offer insights into potential biases in models or data.
There are several reasons why forecast errors occur, including poor data quality, biases in model selection, and external factors like economic changes, unexpected events, and seasonality. Incorrect parameter choices also contribute to forecast errors, as these parameters are central to the estimation process. Additionally, a lack of collaboration among stakeholders and insufficient ongoing evaluation and monitoring can further contribute to errors in forecasting.
Types
Common types of forecast errors are the following:
- Error Sign: Error types can be identified by the positive or negative signs. Positive signs usually indicate overestimation and a greater deviation from actual values. Negative signs reflect underestimation or a smaller deviation from actual values.
- Error Spread: This type of error shows whether the forecast errors are dispersed across multiple areas or concentrated in a few specific areas.
Other common sources of error include uncertainty, model limitations, biases in human judgment, and poor data quality.
Measures
Measures used to calculate the forecast errors are the following:
- Mean: The mean represents the sum of all values divided by the number of values, essentially showing the average.
- Bias: Bias is a consistent error that shows a systematic difference between actual and forecasted values. It can be either high or low.
- MAD (Mean Absolute Deviation): The mean absolute deviation shows the magnitude of the average errors in a forecast. It represents the absolute values of deviations between the expected and actual results.
- MAPE (Mean Absolute Percent Error): Mean absolute percent error expresses forecast errors as a percentage of sales volume, showing by how many percentage points forecasts deviate on average.
- MASE (Mean Absolute Scaled Error): Mean absolute scaled error is the mean absolute error of forecasted values divided by the mean absolute error of in-sample predictions. It helps assess the relative accuracy of forecasts.
- MSE (Mean Squared Error): Mean squared error measures the average squared differences between actual and predicted values. It is calculated by dividing the sum of residuals by the total number of data points and then taking the square root of the result.
- Tracking Signal: A tracking signal measures persistent bias. It is the ratio of the cumulative algebraic sum of deviations between actual and forecasted values to the mean absolute deviation of the data.
- WMAPE (Weighted Mean Absolute Percent Error): Weighted mean absolute percent error assigns weights to errors by evaluating actual demand. Items with higher priority are given more weight, making the forecast error biased toward them.
Examples
Let us look at some of the examples to understand the concept better.
Example #1 - A Hypothetical Example
Company ABC Ltd forecasted its yearly sales as $100,000, but the actual sales for the year were $80,000. In order to calculate the forecast error, the company’s forecasted value is subtracted from the actual value:
Forecast error = Actual value – Forecasted value
$80,000 – $100,000 = -$20,000.
Example #2 - A Real-Life Example
Lyft made a forecast error, stating that a key profit (EBITDA) margin would rise by 500 basis points instead of the correct figure of 50 basis points. This mistake caused a 67% surge in its stock price before the CFO, Erin Brewer, corrected the error. Despite the correction, Lyft's shares still rose by 34%, potentially adding $1.65 billion to its market value. The forecast error has raised concerns of possible regulatory or legal action, as the SEC might review the situation.
How To Minimize?
Forecasting errors can be minimized by adopting the following measures:
- Use of Better Models: Investing in robust forecasting models, such as exponential smoothing or machine learning algorithms, can lead to more accurate results.
- Data Preprocessing: One common source of errors is inappropriate data selection. Data must be thoroughly preprocessed and cleansed to eliminate noise and inaccuracies. This includes addressing missing values, detecting outliers, and transforming variables as needed.
- Ensemble Approaches: Combining multiple models can help reduce errors. Techniques such as stacking, boosting, and bagging can be employed to merge data from different models for improved accuracy.
- Continuous Adaptations: Models should be regularly updated as new data becomes available. Predictions can be adjusted automatically for better precision by continuously adapting to new information.
- Analysis of Different Scenarios: Evaluating various scenarios—such as best-case, possible outcomes, and worst-case scenarios—helps quantify the impact of different assumptions. This improves forecasting accuracy by considering a range of possibilities.
- Incorporation of External Variables: Incorporating external factors such as seasonality, economic changes, events, and market trends into models can lead to more accurate forecasts. These external influences help in refining calculations for more reliable results.
