List of Economics Formulas
The term economics signifies how consumption, production, and distribution of goods and services happen. It further indicates how well the individuals and businesses allocate resources to derive maximum value addition. The formulas on economics can be elaborated on the macroeconomic and microeconomic levels.
Key Takeaways
• Economics formulas play a crucial role in understanding goods and services consumption, production, and distribution. They help individuals and businesses optimize resource allocation for maximum value creation. These formulas are applicable at both macroeconomic and microeconomic levels.
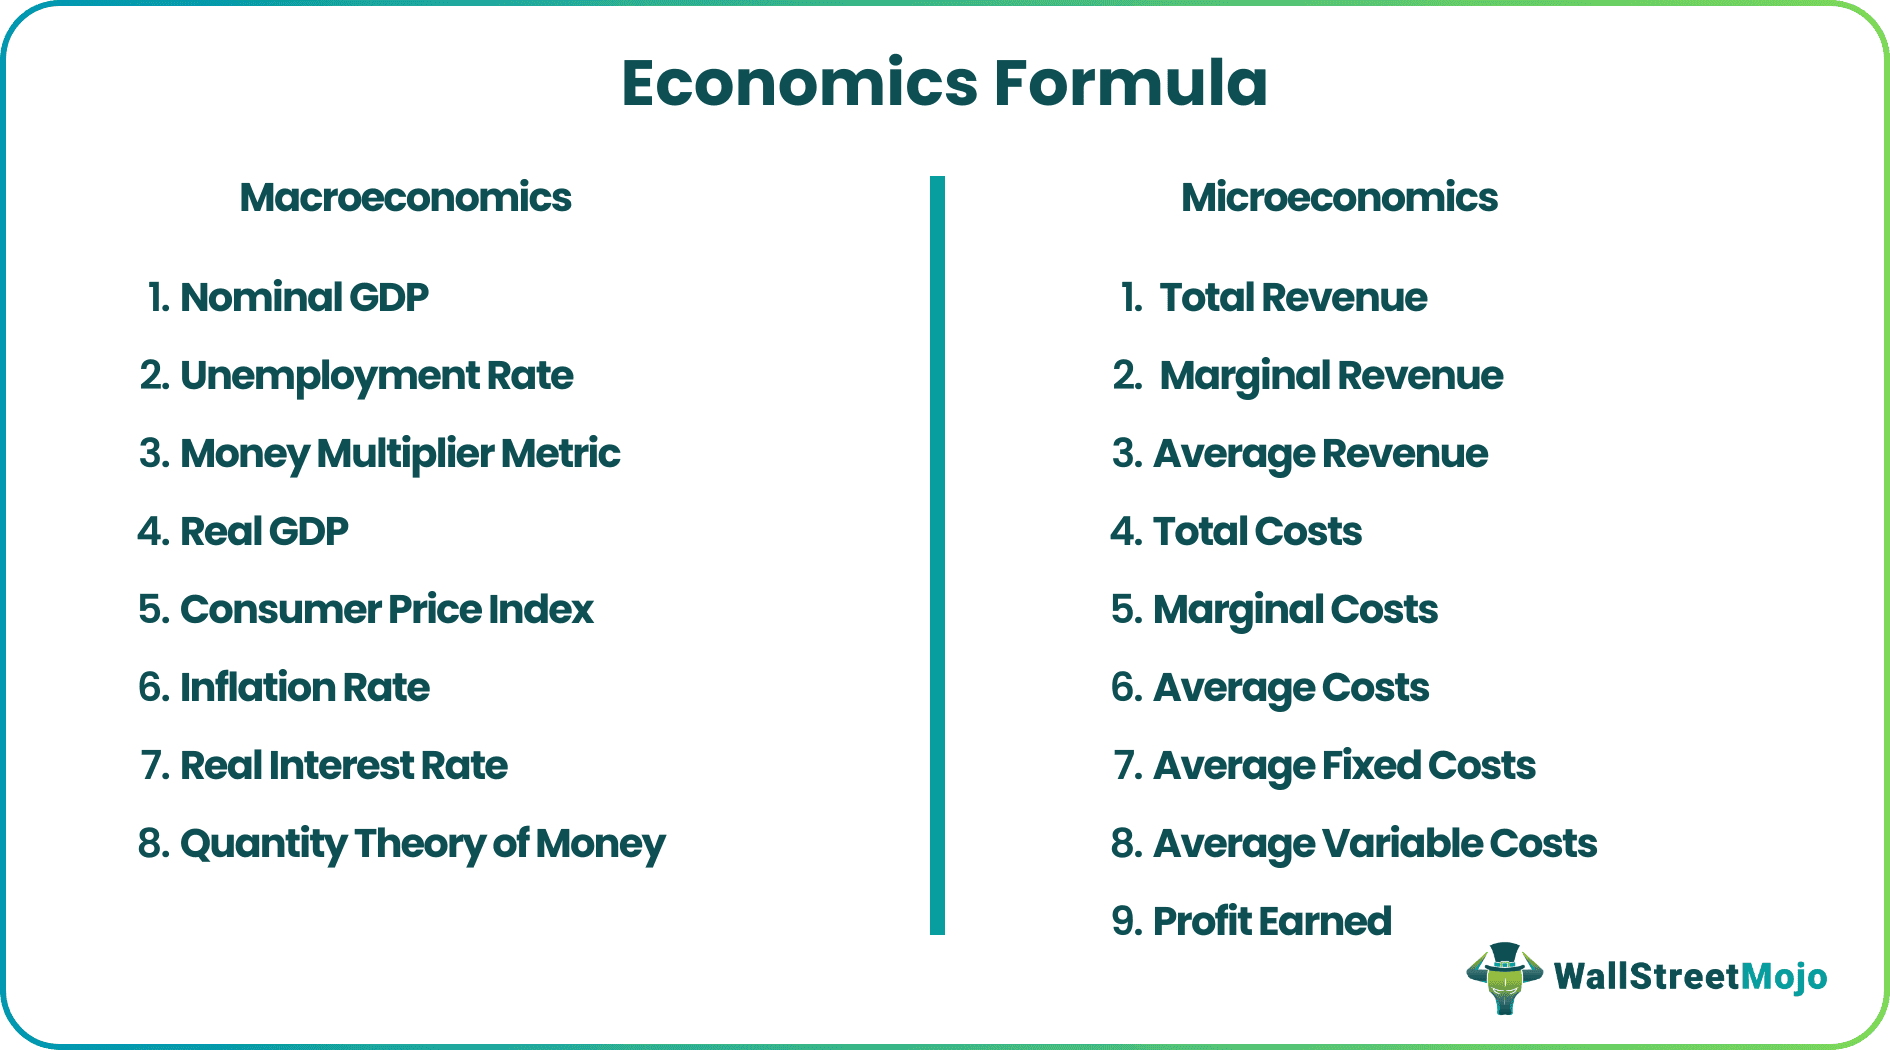
• Some essential macroeconomic formulas include gross domestic product (GDP), unemployment rate, money multiplier rate, real GDP, consumer price index (CPI), inflation rate, real interest rate, and quantity of money.
• At the microeconomic level, key formulas include total revenue, marginal revenue, average revenue, total cost, marginal cost, total average cost, average fixed costs, average variable costs, and profit firms earn.
As per the macroeconomics, the following economics formulas help in understanding the position of the economy as follows: –
Macro-Economics Formulas
The following are the top 8 macroeconomics formulas –
#1 – Gross Domestic Product
The gross domestic product can be expressed per the expenditure approach and net income approach. As per the expenditure approach,
the gross domestic product is expressed as the sum of private consumption investments followed by government expenditures and the net exports happening in the nation. On the other hand, the income approach is determined as the sum of labor, interest, rent, and the remaining profits.
Mathematically, two formulas can be expressed as follows: –
GDP = C + G + I + NX
Here,
- The consumption is represented by C.
- G represents the government expenditures.
- I represent an Investment.
- The net exports are represented by NX.
GDP = W + I + R + P
Here,
- The labor is represented by W.
- I represent the Interest.
- The rent is represented by R.
- The remaining profits are represented by P.
#2 – Unemployment Rate
The economics can also be assessed as per the unemployment rate in the country. It is normally determined as the ratio of the count of the unemployed labor force to the count in the employed labor force.
Mathematically it can be represented as follows: –
Unemployment Rate= Total number of Unemployed / Total number of employed individuals.
#3 – Money Multiplier Rate
The next metric to understand the situation of the economy is by utilizing the money multiplier metric. It is normally defined as the inverse of the reserve ratio maintained by the bank. Mathematically, it can be represented as follows: –
Money Multiplier Metric = 1 / Reserve Ratio
This metric helps assess how the money deposits can be utilized to enhance the supply of money in the system.
#4 – Real GDP
The real GDP is determined as the ratio of nominal GDP and the GDP deflator. The real GDP is instrumental in the computation and assessment of economic output along with the adjustment for deflation or inflation. The nominal GDP assesses economic output without the effect of inflation and hence Real GDP is considered a better measurement tool than the Nominal GDP.
The Real GDP is expressed as follows: –
Real GDP = GDP on Nominal Terms / Deflator of GDP.
#5 – Consumer Price Index
The consumer price index is determined as the ratio of the cost of products and services for a given year to the cost of products and services for a determined base year. This metric helps in comparing prices for products and services and the changes in the inflation levels. The basket for products and services is to be updated daily, followed by the determination of the cost of the basket and the determination of the Index.
Mathematically, it can be represented or described as follows: –
Consumer Price Index = Cost of products and Services for the Given Year/Cost of Products and Services for the Determined Base Year.
#6 – Inflation Rate
The inflation rate signals how the prices of services and products have shaped up from year to year. The rate is computed as the difference between the current year CPI level and last year’s CPI level with last year’s CPI level. It is further expressed in percentage terms.
The inflation rate can be expressed as follows: –
Inflation Rate = (Changes in CPI levels/levels of CPI last year) x 100
Here,
- Changes in CPI Levels = Levels of CPI for current-year – levels of CPI index last year.
#7 – Real Interest Rate
The real rate of interest is determined as the difference in the nominal interest rate and inflation rates. Alternatively, it can be determined using Fischer’s Equation. As per Fischer’s Equation, it is determined as the ratio of nominal interest rates and inflation rates.
Mathematically, it can be expressed as follows: –
Real Interest Rate = Interest Rate in Nominal Terms – Rate of Anticipated Inflation
As per Fischer’s equation, it can be expressed as follows: –
Real Interest Rate = (1 + Nominal Rate) / (1 + rate of inflation) – 1
#8 – Quantity Theory of Money
This relationship can be described as a direct relationship between money and output levels. John Maynard Keynes postulated this relationship.
Mathematically, this relationship would be described or illustrated as follows:
MV = PT
Here,
- M represents the supply of money.
- The circulation or speed of the money is expressed as V.
- The mean level of prices is expressed as P.
- The transaction volume of services and goods.
Therefore, in Macroeconomics, the following can be summarized as follows: –
| Sr No | Formula Name | Formula |
|---|---|---|
| 1 | Nominal GDP | GDP = C + G + I + NX |
| 2 | Nominal GDP | GDP = W + I + R + P |
| 3 | Unemployment Rate | Total number of Unemployed / Total number of employed individuals |
| 4 | Money Multiplier Metric | 1/Reserve Ratio |
| 5 | Real GDP | GDP on Nominal Terms / Deflator of GDP |
| 6 | Consumer Price Index | Cost of products and Services for the Given Year/Cost of Products and Services for the Determined Base Year. |
| 7 | Inflation Rate | (Changes in CPI levels/levels of CPI last year) x 100 |
| 8 | Real Interest Rate | Interest Rate in Nominal Terms – Rate of Anticipated Inflation |
| 9 | Real Interest Rate | (1 + Nominal Rate) / (1 + rate of inflation) – 1 |
| 10 | Quantity Theory of Money | MV = PT |
Microeconomics Formulas
The following are the top 9 microeconomics formula –
As per the microeconomics, the help of the following formula in understanding the position of the economy is as follows: –
#1 – Total Revenue
It is defined as the situation wherein demand is assessed in terms of price elasticity. It is expressed as the product of the overall price and the quantity in demand. If the prices are high, it will result in inelastic demand on prices wherein higher prices result in more revenues. Demand is elastic when the prices are high and results in low volumes.
Mathematically, it can be illustrated as follows: –
#2 – Marginal Revenue: –
The marginal revenue is expressed as the ratio of total revenue changes with respect to the modifications in the quantity retailed. Marginal revenue is the additional revenue earned for the additional quantity sold. Mathematically, it can be illustrated as follows: –
#3 – Average Revenue
Revenues can be described as the receipts a firm received once it sold finished goods to its consumers. The average revenue is the total revenue ratio concerning the overall quantity sold. Mathematically, it can be illustrated as follows: –
#4 – Total Cost
Under economics, the total cost is determined as the sum of fixed and variable costs. Fixed costs are the type of costs that endure being the same throughout the levels of quantity sold by the business. The variable costs are the costs that tend to vary with the level of goods sold by the organization.
Mathematically, it can be illustrated as follows: –
#5 – Marginal Cost
This is defined as the appreciation or deterioration in the overall costs that the business incurs while it prepares finished goods ready for the sale. Graphically, marginal costs are plotted as a U-shaped curve wherein the costs appreciate initially and as the production rises, the costs deteriorate.
Mathematically, it can be illustrated as follows: –
#6 – Average Total Cost
The average total cost is the total costs incurred by the business involved in manufacturing and production to the number of items produced by the business. In such a relationship, determine the total costs and total quantity to arrive at the average total costs. Mathematically, it can be illustrated as follows: –
#7 – Average Fixed Costs
is the total fixed costs incurred by the business involved in manufacturing and production to the number of items produced by the business. In such a relationship, determine the total fixed costs and total quantity to arrive at the average total fixed costs.
Mathematically, it can be illustrated as follows –
#8 – Average Variable Costs
The average variable cost is defined as the total variable costs incurred by the business involved in manufacturing and production to the number of items produced by the business. In such a relationship, determine the total variable costs and total quantity to arrive at the average total variable costs. Mathematically, it can be illustrated as follows: –
#9 – Profit Made by the Firm
In microeconomics, profit could be computed using several relationships. Firstly, it can be computed as the difference between total revenues and costs. It can be computed as the difference between marginal revenue and marginal costs. Whenever the profits are lesser than average variable costs, the business can no longer sustain itself, and it has to be shut down. Mathematically, it can be illustrated as follows: –
It can additionally be illustrated as follows: –
When marginal revenue exceeds marginal costs, the organization or firm should produce more items to enhance its profitability. Similarly, the organization or firm should produce fewer items to lower costs when marginal revenue deteriorates below marginal costs.
Therefore, in Microeconomics, the following can be summarized as follows: –
| Sr No | Formula name | Formula |
|---|---|---|
| 1 | Total Revenue | Price x Quantity in Demand |
| 2 | Marginal Revenue | Changes in total revenues earned / Changes in the quantity traded |
| 3 | Average Revenue | Total Income or Revenue Earned by the Business / Total Quantity |
| 4 | Total Costs | Total Costs Incurred on a Fixed Basis + Total Costs that Varies with the Quantity Produced |
| 5 | Marginal Costs | Changes in the Level of Total Costs / Changes in the Level of Quantity Produced |
| 6 | Averaged Cost | Total Cost / Total Quantity |
| 7 | Averaged Fixed Cost | Total Fixed Costs / Total Quantity |
| 8 | Averaged Variable Cost | Total Variable Costs / Total Quantity |
| 9 | Profit Earned | Total Revenue – Total Costs |
| 10 | Profit Earned | Marginal Revenue – Marginal Costs |
Relevance and Use of Economics Formula
The world bank monitors the nation’s overall financial progress utilizing economic indicators determined by them on periodic intervals. Such reports are made available to the general public utilizing government publications. The nation can be doing well economically if it presents fairly stable economic indicators. Therefore, these economic indicators are broadly recognized as the measure of economic formula.
The popular economic formulas are based on the fact of how the economy is being The popular economic formulas are based on how the economy is being analyzed. For example, suppose the analysis is done on the microeconomic level. In that case, the economic formula is determined as the difference between total revenues generated by the business and the cost incurred to generate the revenue. However, when an analysis is performed at the macroeconomic level, the economic formula is derived by employing the gross domestic product.
An economy always displays how the well human being has utilized the available resources to derive the maximum value addition. Therefore, economics is more related to social science and broadly focuses on spending, consumption, investment, and overall trade achieved in a given financial period.
Frequently Asked Questions (FAQs)
1. What is the PED economics formula?
The Price Elasticity of Demand (PED) formula is given by: PED = (% Change in Quantity Demanded) / (% Change in Price). It measures the responsiveness of quantity demanded to changes in price. If PED > 1, demand is elastic (sensitive to price changes). If PED = 1, demand is unitary elastic. If PED < 1, demand is inelastic (less sensitive to price changes).
2. What is an opportunity cost in the economics formula?
Opportunity cost refers to the value of the next best alternative foregone when a decision is made. The formula for opportunity cost is: Opportunity Cost = Value of Chosen Option – Value of Next Best Alternative. It helps individuals and businesses evaluate trade-offs and make efficient choices in resource allocation.
3. What are the economics formula cheat sheets?
An economics formula cheat sheet is a reference guide that compiles key formulas used in various economic concepts. It includes formulas for elasticity, production functions, cost curves, revenue calculations, and more. It assists students and professionals in quickly accessing and applying essential economic formulas in their analyses and decision-making processes.
Recommended Articles
This has been a guide to Economics Formula. Here we discuss the top list of microeconomics and macro-economics formulas with a detail explanation. You can learn more from the following articles –