Part of our Economic Concepts guide
Econometrics Meaning
Econometrics is the field of economics that help quantify the cause and effect relationship, utilizing the graphical representations correlating the involved factors or elements. It combines statistical and mathematical methods that let users figure out possible outcomes and determine their further plan of action accordingly.
Econometrics acts as a tool to check how strong the cause and effect relationship is to assess the outcomes they can expect in the future. Though this field of study lets users deal in various industries, it has a significant role in the finance sector, enabling them to understand how particular assets are likely to perform in current situations.
- Econometrics is the subset of economics that helps quantify the cause and effect relationship to help economists frame economic policies.
- It is an application of statistics that lets econometricians forecast financial scenarios and build strategies and backup plans accordingly.
- This field of economics is found in two forms – theoretical and applied.
- There is a stepwise sequence that practitioners must follow to obtain reliable quantitative econometrics forecast results for further decision-making.
Econometrics Explained
Econometrics for finance helps study the economic data to let users make future predictions based on the current representations. It becomes an effective technique to turn theoretical economic concepts into practical models to ensure individuals and entities make effective economic decisions keeping all necessary factors in mind.
This field of economics can be classified as micro-econometrics and macro-econometrics. When the cause and effect relationship or the relationship between any two factors is concerned with a single person or entity, it is labeled as micro-econometrics. On the other hand, as the name implies, the macro version involves studying relationships at a macro level, affecting many people.

For example, studying a graph representing the effect of educational qualification on the designations offered by firms can be an example of a micro version of this field of economics. In contrast, the increase in the inflation rate directly affects a large population, which makes it a perfect example of macro-econometrics.
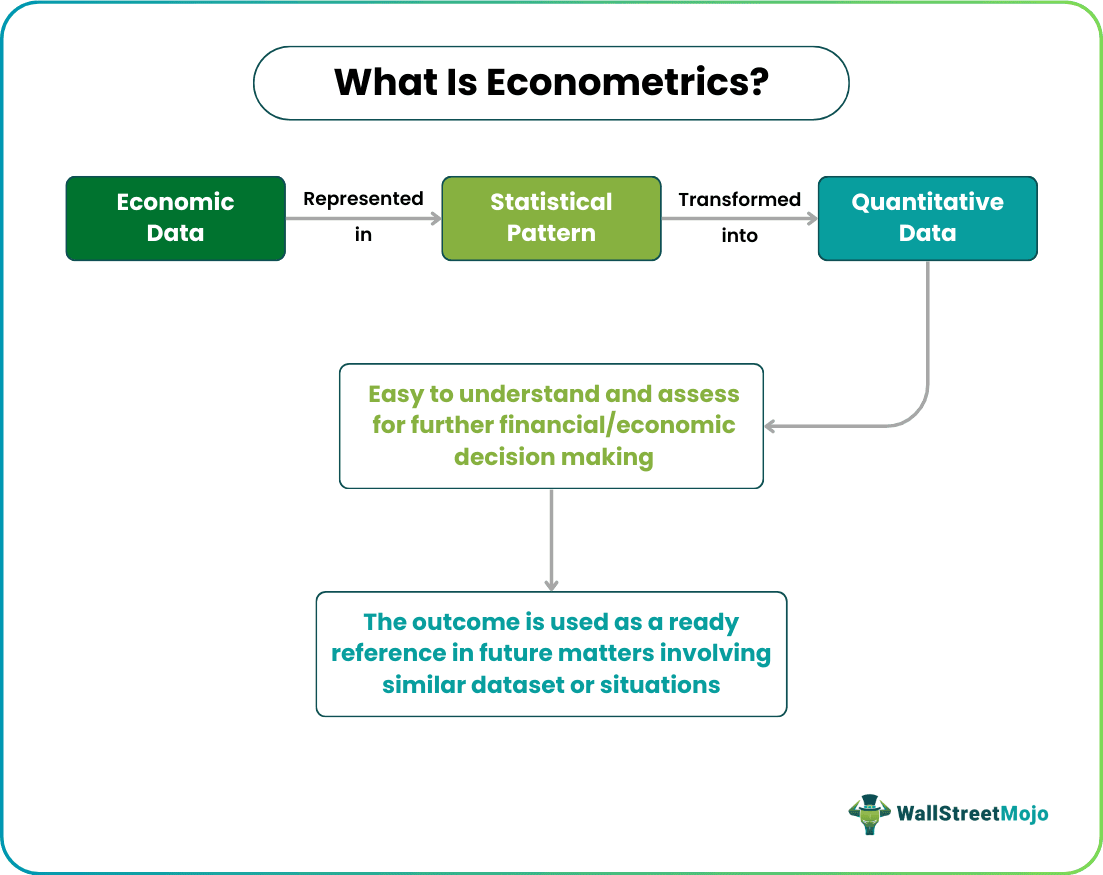
The econometricians consider the versions of economic theorists and transform them into quantitative data, which is easy to read and base decisions on. The field of study finds relevance in varied branches of economics, including economic policies. The people dealing with this niche adopt multiple econometrics models to get to an accurate conclusion for a dependable outcome.
These techniques or methods include probability distribution, regression, linear programming in Excel, estimation theory, time-series analysis, simulation equation, frequency distribution, etc.
Components
The field of study involves two aspects: Theoretical and Applied.
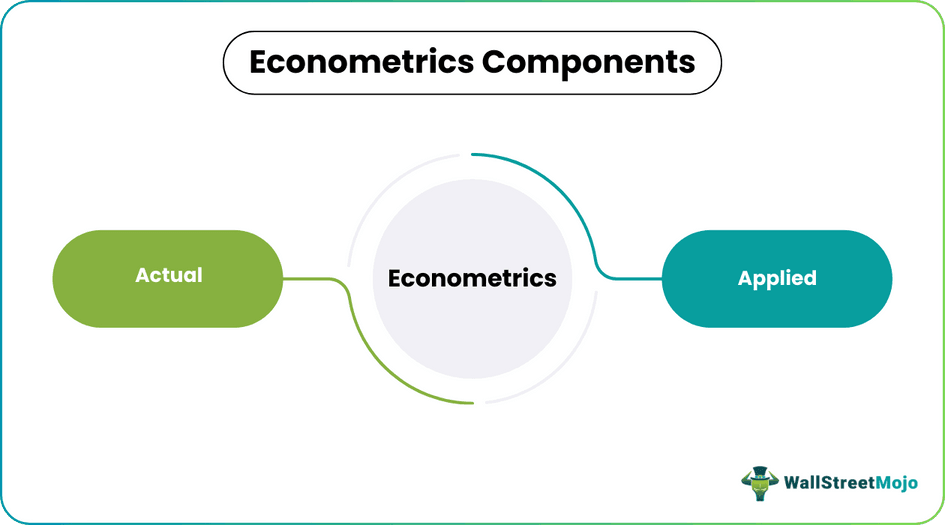
Theoretical specialists examine the features of the statistical procedures adopted previously and still existing. Then, using the same, they try to identify unknown indications by implementing the existing tests and processes in the models. In addition, these experts work on new statistical procedures as per specific matters with peculiar economic data. This is to ensure the outcome derived fits into change-driven situations with respect to correctness.
Applied aces consider the techniques already developed by the theorists and transform them into quantitative versions. As the name suggests, they apply the already derived theories in use.
Stages
Transforming the statistical pattern into quantitative data to make them readable and understandable involves multiple stages. Following the steps properly and in a sequence is a must to achieve reliable results:
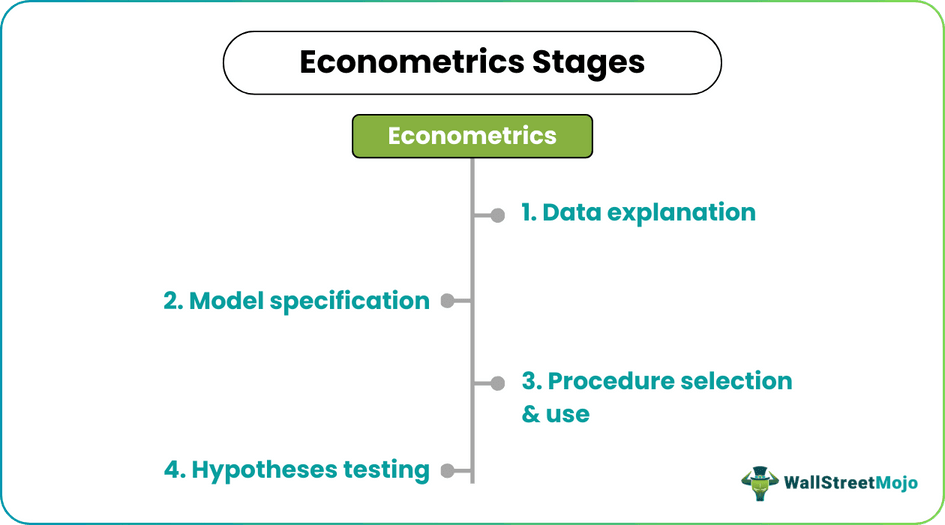
Firstly, practitioners investigate the dataset based on which they recommend a theory, which explains the data, defines the variable, and establishes the relationship between those variables. The economic theory plays a significant role in the process as it helps users proceed with hypothesis formulation.
Secondly, the statistical model required to quantify the economic theory is defined. The economic theory does not make the cause and effect relationship readable enough for users. A statistical model, on the other hand, defines the mathematical relationship between variable, dependent, and explanatory variables.
Thirdly, the specified statistical methods are used for appropriate econometrics forecast of the points that remain unclear in the statistical theory.
Lastly, hypothesis testing is conducted. It acts as a tool to help accomplish the fourth step by determining whether the hypothesis or economic theory should be accepted or rejected. If it is rejected, the practitioners would require coming up with new testing theories to ensure the handling of the economic data well for proper economic policy-making or financial decision making.
Examples of Econometrics
Let us consider the following econometrics examples to understand the concept:
Example #1
Arlene decided to invest in a stock of a popular company. Though she was sure that the stocks would perform well, her experience of huge losses made her keep aside her confidence and conduct a check. As a result, she asked her friend, John, a financial analyst and econometrician by profession, to help her with how volatile the market is expected to be. He conducted the analysis and applied the best tools to ensure his friend invested in a good deal.
John discovered that market volatility is likely to affect the stocks in the upcoming days and months negatively. Accordingly, he conveyed the situation to Arlene, and she decided not to invest for the time being.
Example #2
Michael has an income of $50,000. However, his spending pattern is $10,000, including fixed rent and other household expenses, comprising 50% of his gross income earned.
The relationship between his expenditure and gross income can be derived using econometrics, and the best tool to get accurate results is multiple linear regression based on past trends.
Equation would be = B0 (Intercept) + B1 + e (Error term)
Michael’s expenditure with respect to his income is:
Expense = B0 (Fixed rent) + B1 (other household exp.) + e (Error term)
= $10,000 + 50% ($50,000)
= $35,000
Error term, in this case, is the slight possibility of error in the results, which might be a little up or down from the output obtained.
Application
Econometrics is used in different fields, including science and engineering. However, it is of great significance in the field of finance as it helps in:
- Estimating volatilities
- Determining the possible price-to-earnings ratio
- Framing trading strategies
Advantages and Disadvantages
The advantages and disadvantages of this subset of economics are as follows:
| Pros | Cons |
|---|---|
| Converting data into quantitative form becomes simpler | Based on past theories and beliefs |
| Makes data readable and understandable | Incorrect decisions are made based on inaccurate predictions and trend analysis |
| Helps obtain specified patterns from the scattered sets of data | |
| Enables users to retrieve filtered information as per their need | |
| Finds applicability in almost every field from science and engineering to finance |
Econometrics vs Statistics
Statistics is the field of study that lets statisticians study the data and analyze it for a valid conclusion. On the other hand, econometrics is the subset of economics that utilize statistical tools to examine data and convert them into their quantitative version, making them simpler and more readable to users.
In short, econometrics is one of the applications of statistics that help economists predict economic scenarios, frame policies, and make decisions accordingly.
Frequently Asked Questions (FAQs)
What is econometrics?
Econometrics is the field of economics that help convert existing hypotheses and economic theories into quantitative data so that users can read them well to make relevant economic or financial decisions. Some econometrics techniques or methods used include probability, regression, estimation theory, time-series analysis, simulation equation, frequency distribution, etc.
Is econometrics helpful?
Yes, econometrics is helpful as it lets users read the data or information obtained by assessing the particular pattern or trend indicated by a dataset. It also enables users to retrieve filtered information as per their needs.
Why is econometrics a separate discipline?
Econometrics is a separate discipline used for studying and analyzing economic data. Plus, it helps economists and administrators make significant financial decisions and frame economic policies based on the observations.
Recommended Articles
This is a guide to what is Econometrics and its meaning. Here we explain its components, stages, pros, cons, and application along with proven examples. You may learn more about our articles below on accounting –