What is TTM Revenue / LTM Revenue?
- LTM revenue is an interesting concept. And every investor should look at how it works.
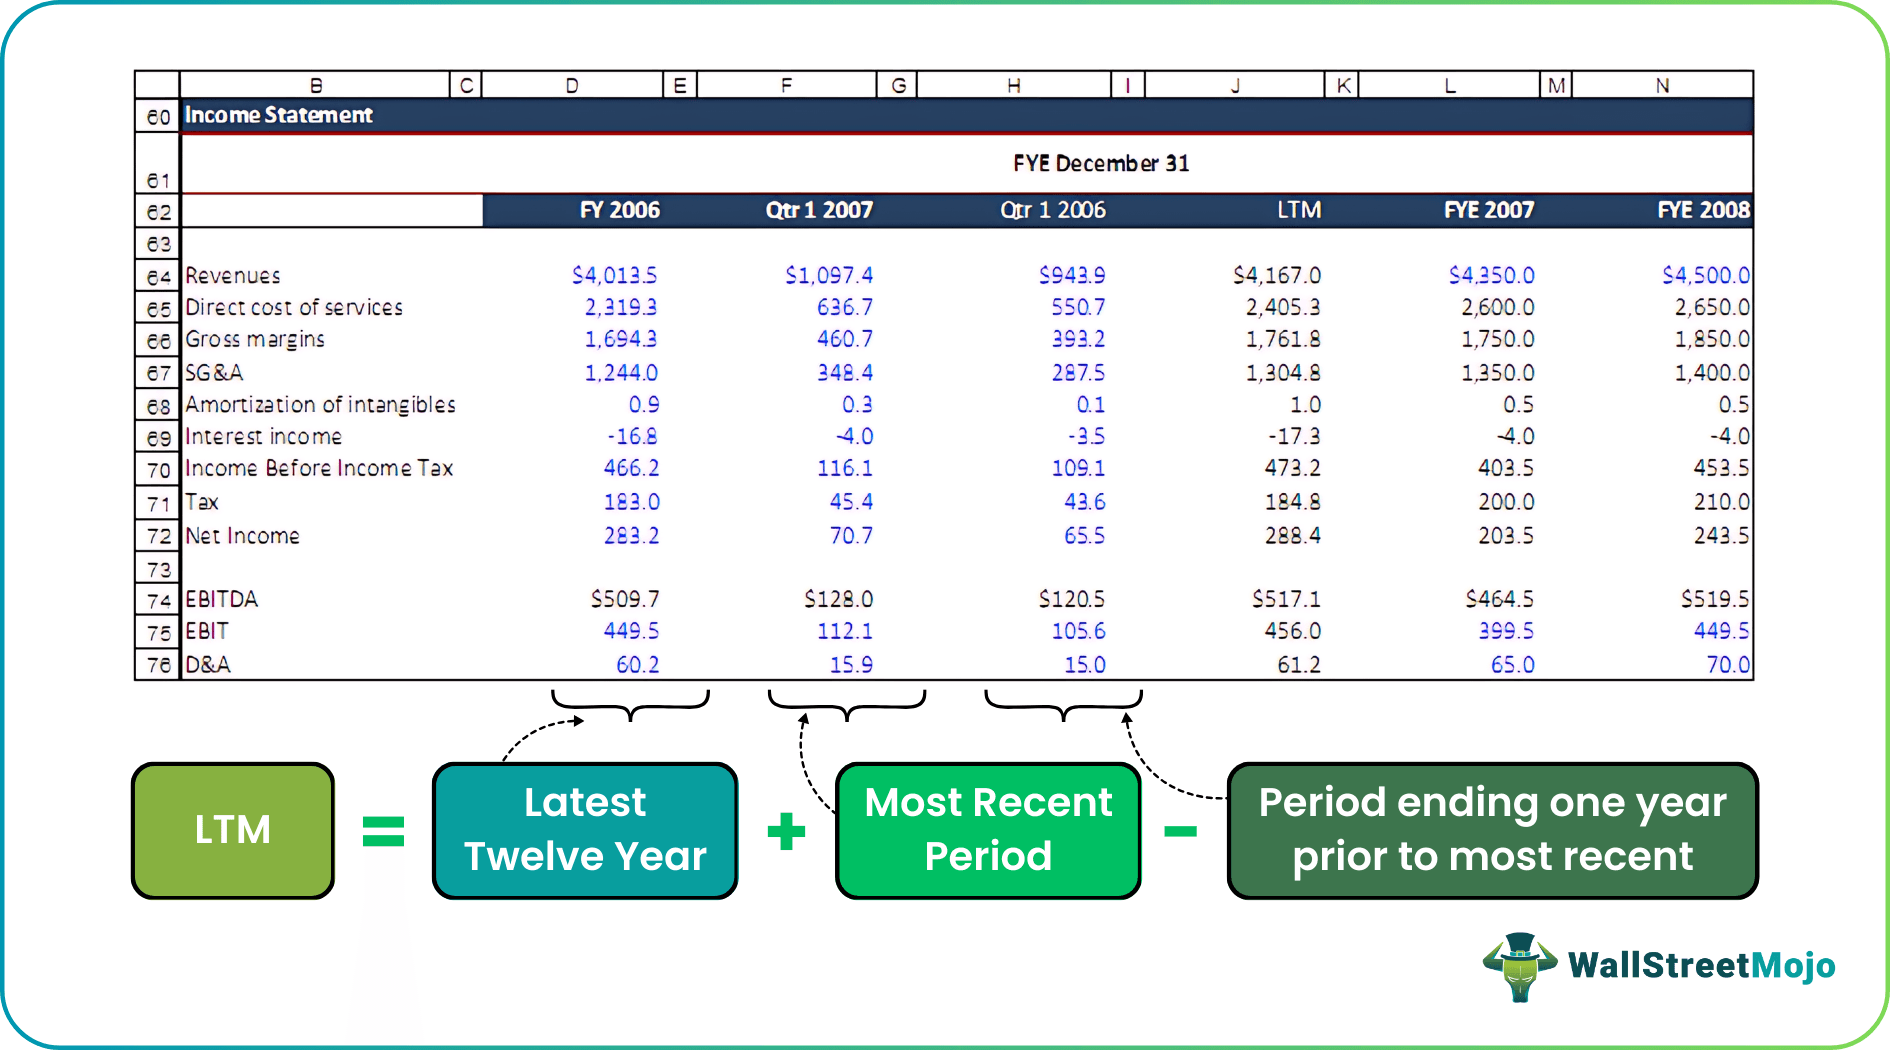
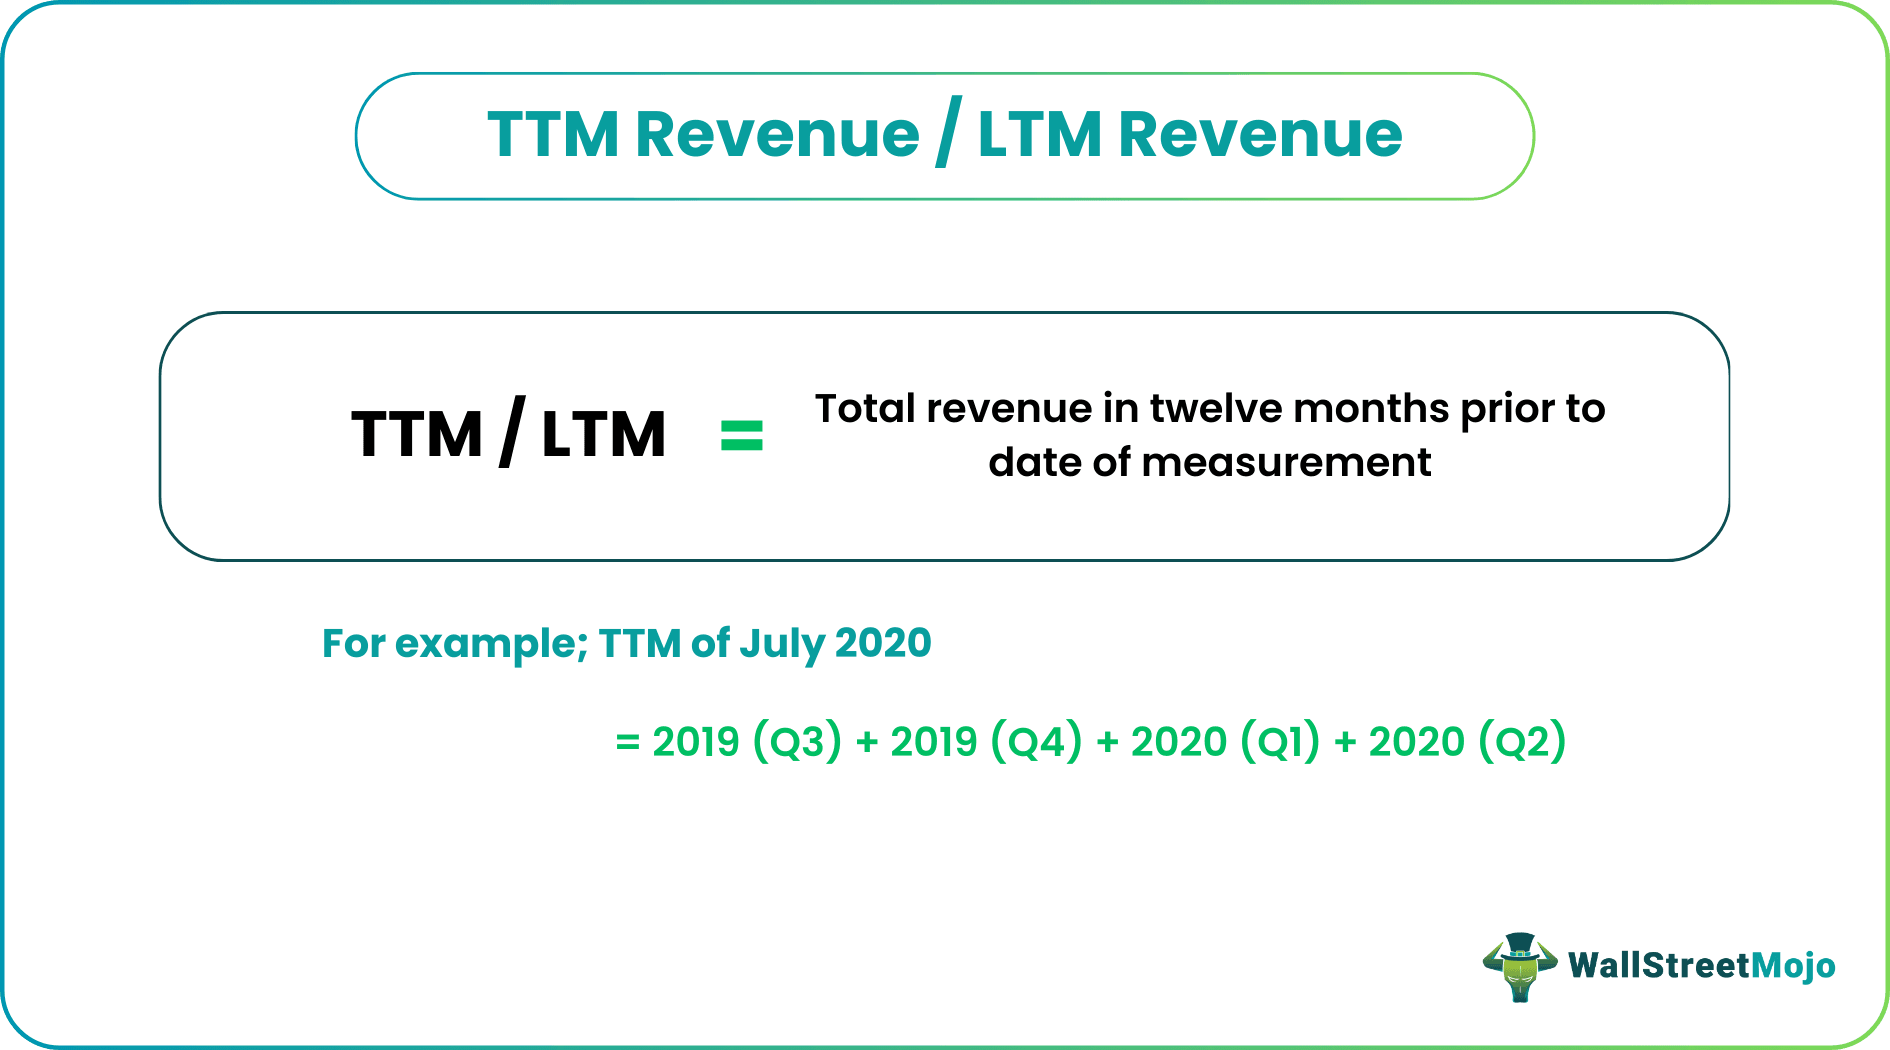
- LTM stands for the last twelve months. These last twelve months’ revenue can also be called TTM revenue (Trailing Twelve Months).
- When an investor wants to understand how a firm is doing financially, she uses LTM revenue as a measurement. And in most cases, firms prepare their financial reports for the past twelve months (the last 12 months).
- LTM Revenue/TTM Revenue helps us look at a profit for the whole year instead of just glancing at quarterly profits.
LTM Revenue vs. Quarterly Revenue – Which is better for Financial Analysis
Let’s understand this by taking an example.
Let’s say that Company Prince Toys Ltd. has the following information –
- TTM Revenue for the last year – $400,000
- Quarterly revenue for the last quarter – $92,000
If, as an investor, we look at the last quarter or for two quarters, we would get a recent figure. But the point is by looking at the recent figure, you’re skipping an important consideration.
Looking at quarterly revenue, you cannot judge whether the company has earned that revenue due to seasonal reasons. For example, it may so happen that due to the festive season, the firm has sold more toys than the rest of the year. Or on the other hand, it may sell fewer toys due to labor problems, strikes, etc.
As an investor, to understand a company’s financial health, you need to look at it holistically, not partially.
That’s why understanding TTM Revenue is more important than the Quarterly Revenue.
Video Explanation of TTM Revenue/LTM Revenue

Calculate TTM Revenue
For investors who have just started, this method would be useful to you on two bases –
- You would be able to calculate the LTM Revenue of any firm’s year.
- You would be able to compare the LTM Revenue of the same/different firm/s whenever you get the figure.
Let’s look at the method of calculating LTM Revenue.
Oh Yes, the Ice-cream Company has the following information for you –
| Quarter | 2016 | 2017 |
|---|---|---|
| July to September | $50,000 | – |
| October to December | $62,000 | – |
| January to March | – | $54,000 |
| April to June | – | $49,000 |
| July to September | – | $57,000 |
Find out the LTM Revenue for June 2016 and September 2016.
All we need to do is to add quarterly revenues.
So, we will first calculate the TTM Revenue for June 2016.
- For calculating TTM Revenue for June 2016, we need to add July to September, October to December, January to March, and April to June.
- Here’s the calculation = ($50,000 + $62,000 + $54,000 + $49,000) = $215,000.
Now, we will calculate the TTM Revenue for September 2016.
- For calculating the TTM Revenue for September 2016, we need to add October to December, January to March, April to June, July to September.
- Here’s the calculation = ($62,000 + $54,000 + $49,000 + 57,000) = $222,000.
Calculating the Last twelve months’ revenues for June 2016 and September 2016 has served a purpose. As an investor, you can now look at the quarterly revenues holistically (not periodically).
Since the LTM revenues average out the seasonal changes (if any) from quarterly revenues, as a result, LTM/TTM revenues provide more clarity to the investors before they ever get interested in investing in the company.
Even the balance sheet doesn’t affect the Last twelve months’ Revenue. The balance sheet is prepared at a single point in time, no matter what happens throughout the year.
Use of LTM Revenue
Why do investors and financial analysts use LTM Revenue? Here’s a small list –
- The last twelve months’ Revenue is considered more recent than the annual reports. If the investor looks at the annual report in the middle of the next year, she would only understand what happened last year. As a result, the first six months of this year will be skipped. But if she calculates LTM revenue, she would get the company’s most recent figures.
- Short-term measurements don’t serve investors and financial analysts. Revenue for the immediate year may not be a big chunk of time, but it serves the purpose.
- Financial analysts prefer TTM revenue because, while acquisition, TTM revenue provides the most accurate value of the business.
- The last twelve months’ revenue allows investors to compare the relative performances of similar companies in the same industry.
Recommended Articles
This article has been a guide to LTM Revenues and their meaning. Here we discuss how to Calculate TTM Revenue (Trailing Twelve Months) and examples. Here we also discuss why LTM revenue is very important for financial analysis.